. 2001 Mar;183(6):2059-70.
doi: 10.1128/JB.183.6.2059-2070.2001.

Regulatory architecture of the iron-regulated fepD-ybdA bidirectional promoter region in Escherichia coli

Affiliations

Regulatory architecture of the iron-regulated fepD-ybdA bidirectional promoter region in Escherichia coli

C A Christoffersen et al. J Bacteriol. 2001 Mar.

Abstract

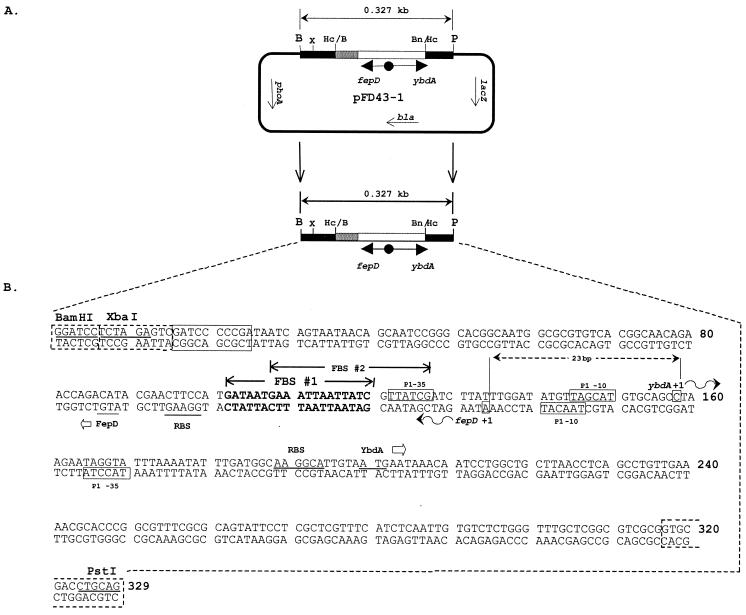
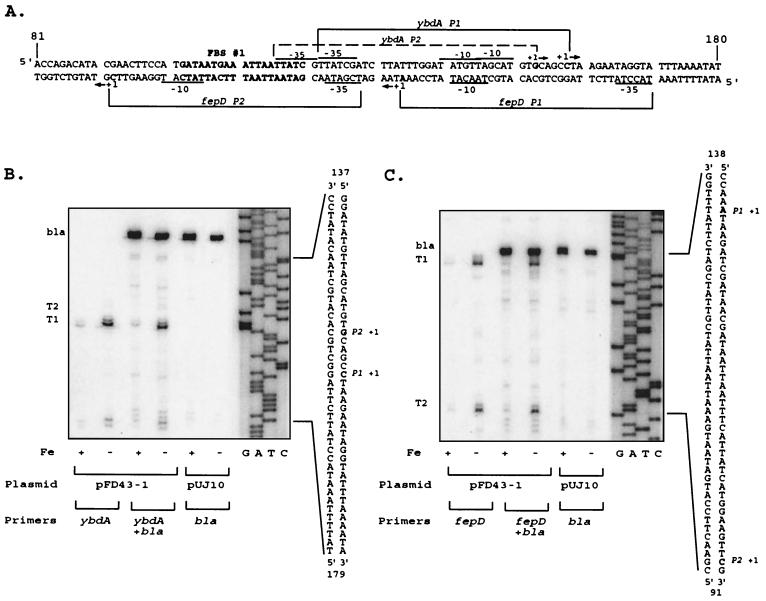
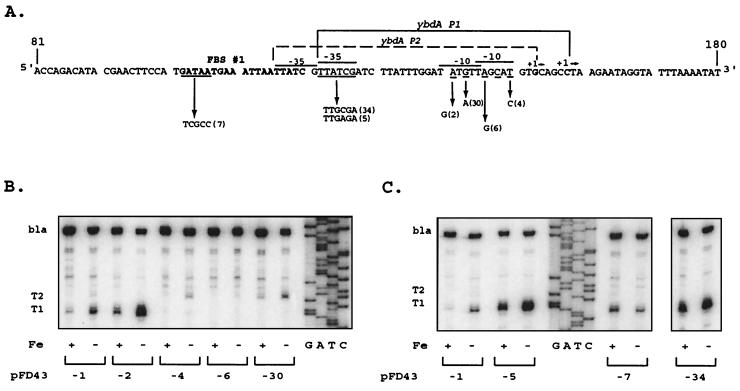
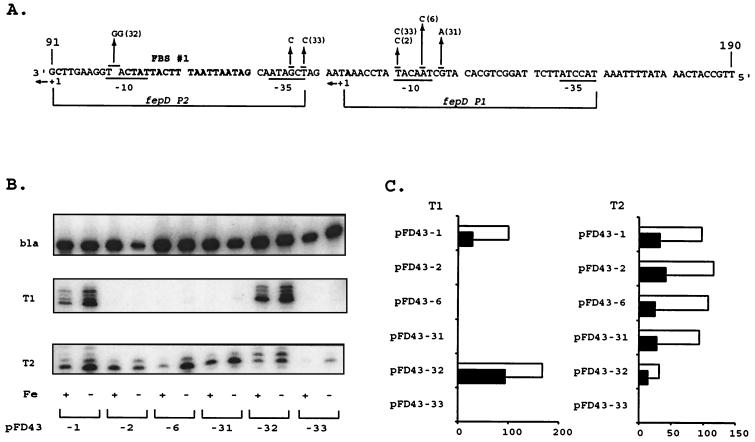
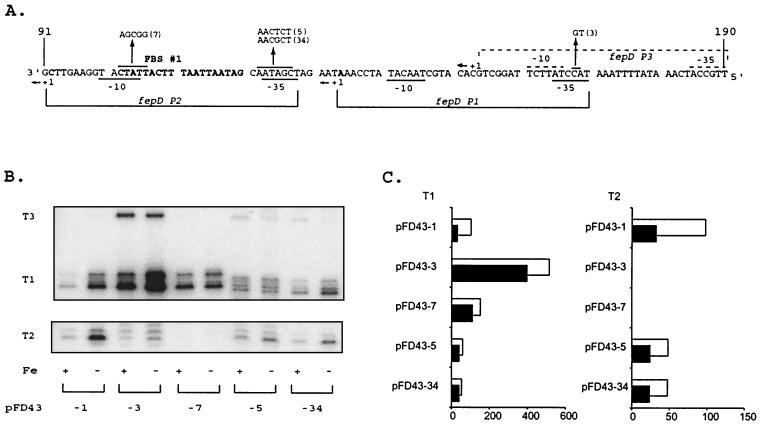
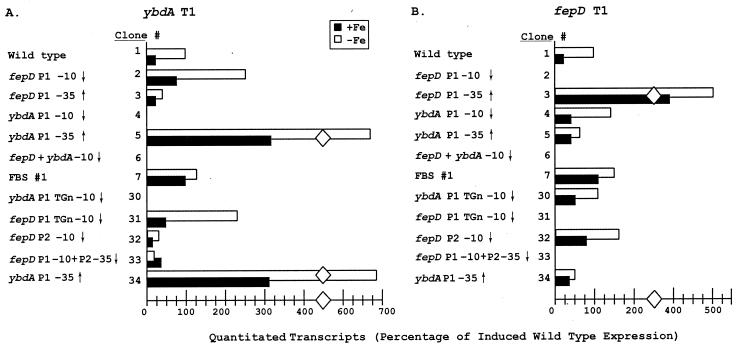
The overlapping and opposing promoter elements for the Escherichia coli fepDGC operon and the ybdA gene (encoding a 43-kDa cytoplasmic membrane protein) within the enterobactin gene cluster were investigated by measuring the effects of site-specific mutations on transcript levels and on expression of reporter genes in a bidirectional transcriptional fusion vector. Primary promoter structures for the opposing transcripts overlapped extensively such that their -10 sequences were almost directly opposed on the two strands of the DNA helix and their +1 transcription start sites were only 23 bp apart. Relative to the E. coli consensus sequence, both promoters were poorly conserved at the -35 position and mutations which strengthened the -35 element of either promoter significantly enhanced its transcription, decreased that of the opposing promoter, and dramatically altered iron-mediated regulation of expression. Both the fepD and ybdA primary promoters were shown to require a 5'-TGn-3' upstream extension of their -10 elements for optimal activities. Secondary promoters were identified for both fepD and ybdA, and their contributions to the overall expression levels were evaluated in these dual expression vector constructs. The data provided strong evidence that the architecture of the regulatory elements within the overlapping fepD and ybdA promoters is configured such that there is a direct competition for binding RNA polymerase and that the expression levels at these promoters are influenced not only by the activity of the opposing promoters but also by additional promoter sequence elements and perhaps accessory regulatory factors. Iron-mediated regulation of these promoters through the repressor protein Fur is a consequence of the relative promoter strengths and the position of an operator site that consists of two overlapping Fur-binding sequences in this compact regulatory region.


Figures

FIG. 1
FIG. 1
The fepD-ybdA bidirectional transcription fusion vector and sequence of the transcriptional control region. (A) Structure of the wild-type promoter construct, pFD43-1, with fepD fused to phoA and ybdA to lacZ. Abbreviations for the restriction enzymes used: B, BamHI; Bn/Hc, BanI-HincII hybrid site; Hc/B, HincII-BamHI hybrid site; P, PstI; X, XbaI. Plasmid reporter genes are lacZ (β-galactosidase) and phoA (alkaline phosphatase); bla is the selectable β-lactamase gene and serves as an internal standard for transcript quantitation. Arrows within constructs designate the direction of the transcripts. (B) Sequence of the 329-bp region containing the promoter cassette used for mutagenesis, nucleotide sequencing, and reporter gene analysis. The BamHI and PstI cloning sites are noted. Boxed sequences at the termini originate from the vectors used in construction steps (see Materials and Methods). The boxes with dashed edges are from the M13mp19 polylinker, and the solid box near the left end of the sequence is from the pCON4 vector. These sequences are represented by the black and gray boxes, respectively, in the vector map in panel A (not to scale). Predicted overlapping primary 19-bp Fur-binding core sequences are identified and labeled FBS #1 and FBS #2. Putative primary promoter elements (P1) for the fepD and ybdA genes are represented and labeled. The +1 primary transcriptional start sites for ybdA and fepD are identified, and the curved arrows denote the direction of transcription. The proposed ATG translational start sites for both the FepD and YbdA proteins and their predicted corresponding ribosome binding sequences are underlined. Nucleotides are numbered 5′ to 3′ from the BamHI site to the PstI site.
FIG. 2
FIG. 2
Transcripts originating from the fepD-ybdA bidirectional promoter region. (A) Sequence of the fepD-ybdA promoter region (extending from bp 81 to 180 shown in Fig. 1). The predicted “iron box” sequence (50) is boldfaced and designated as FBS #1. Brackets delineate the extent of the designated promoter regions, with corresponding −10 and −35 elements noted for each. The −10 TGn extensions for both P1 promoters are not designated. The dominant transcriptional start sites are shown in boldface and are denoted by +1, and the direction of transcription is indicated by the arrows alongside. (B) ybdA primer extension. Oligonucleotide pe4 (Table 1) was end labeled and used to map the ybdA transcription start sites as described in Materials and Methods. T1 and T2 represent the transcripts corresponding to the ybdA P1 and P2 promoters, respectively; bla represents the bla control transcript generated from the same RNA population with primer M8 (Table 1). The sequence ladder was generated with the pe4 primer on double-stranded pFD43-1 DNA template and was run alongside the extension reactions to identify the 5′ ends of the transcripts, which are noted on the corresponding sequence alongside. Conditions for cell growth prior to RNA isolation, the plasmid template for RNA expression, and primers used are given below the extension autoradiograms. Fe +, high iron; Fe −, low iron; pFD43-1, wild-type fepD-P43 promoter region; pUJ10, vector control. Primers (Table 1): ybdA, pe4 primer; ybdA + bla, pe4 and M8 primers; bla, M8 primer alone. (C) fepD primer extension. Oligonucleotide pe2 (Table 1) was used to map the fepD transcription start sites and generate the sequence markers. T1 and T2 represent the transcripts corresponding to the fepD P1 and P2 promoters, respectively, and bla represents the bla control transcript generated on the same RNA with primer M8 (Table 1). Conditions and designations are as described for the ybdA data in panel B.
FIG. 3
FIG. 3
Primer extension of ybdA promoter mutants. (A) Nucleotide sequence of wild-type and mutant ybdA promoters (only the relevant strand is shown). Promoters are identified as in Fig. 2. Nucleotides underlined represent those altered by site-directed mutagenesis using “m” primers (Table 1). The corresponding arrow points from the wild-type bases to the altered bases, followed by the identification number in parentheses, which corresponds to the number after “pFD43” in panels B and C and Table 2. The number in parentheses corresponds as well to the primer number in Table 1. (B and C) Primer extension analysis of mRNA expressed from wild-type and mutant promoters. Primer pe4 was used in extension reactions with mRNA from pFD43-1 and from the designated mutant derivatives, as described in Materials and Methods. Only the relevant portions of the autoradiograms are shown. The sequencing ladder was generated with primer pe4 and pFD43-1 as templates. RNA preparations from high-iron (+) and low-iron (−) cultures are designated as in Fig. 2. As shown in panel C, extension products for pFD43-34 were analyzed on the same gel but were separated from the other preparations shown.
FIG. 4
FIG. 4
Primer extension analysis of the fepD promoter mutants. (A) Nucleotide sequence of the fepD promoter region (note that the sequence polarity is 5′ → 3′ from the right). The fepD P1 and P2 promoters are designated as in Fig. 2. Mutational alterations are designated as described in Fig. 3. (B) Primer extension of mRNA expressed from wild-type and mutant promoters. Primer pe2 was used in extension reactions with mRNA from pFD43-1 and from designated mutant derivatives, as described in Materials and Methods. Only the regions of the autoradiograms around T1 and T2 are shown. The fepD transcript mapping was performed independently of the bla control since the extension product with the bla-specific primer was similar in size to the fepD T1 transcripts. bla control transcripts were identified from separate reactions using the same mRNA populations, were separated on the same gel, and are presented above the extension reactions. RNA preparations from high-iron (+) and low-iron (−) cultures are designated below each lane. (C) Comparative effects of the mutations on both fepD transcripts. The bar graph depicts the relative contributions from the two fepD transcripts (T1 and T2), quantitated from primer extension gels by PhosphorImager analysis (as described in Materials and Methods) relative to the normalized bla transcript control from the same RNA samples. Data are presented for each designated clone as percentages of the induced levels of the wild-type fepD T1 transcript, arbitrarily defined as 100%. T1 and T2 represent the fepD transcripts derived from the fepD P1 and P2 promoters, respectively. Black bars represent repressed high iron (+ Fe) levels, while empty bars represent the induced (−Fe) condition.
FIG. 5
FIG. 5
Transcript analysis of the fepD promoter-operator mutants. All components are configured and labeled as described in the legend to Fig. 4. The promoter elements for the fepD P3 promoter (A), which were mapped according to the newly identified T3 transcript from pFD43-3 (B), are denoted by dotted overlines, and the relevant + 1 site is identified. (C) T1 and T2 represent the fepD transcripts derived from the fepD P1 and P2 promoters, respectively. Black bars represent repressed high iron levels, while empty bars represent the induced (− Fe) condition.
FIG. 6
FIG. 6
Comparative effects of promoter mutations on the opposing transcripts, with quantitative comparison between the ybdA and fepD T1 transcripts expressed from the wild-type and mutant promoter-operator regions. Quantitation was achieved by comparison to the normalized bla transcript within each RNA preparation (as described in Materials and Methods). Data are presented as the percentage of induced wild-type expression of the ybdA T1 transcript (A) or the fepD T1 transcript (B). Black bars represent high-iron conditions, while empty bars represent low-iron culture conditions. In both cases, the diamond is used to represent a 150-U break in the bar graphs. The different clones, no. 1 to 7 and 30 to 34, are presented under the column “Clone #.” The ↑ and ↓ designate the mutant as one in which the consensus of the corresponding promoter region was increased and decreased, respectively.

References

    1. Adhya S, Miller W. Modulation of the two promoters of the galactose operon of Escherichia coli. Nature. 1979;279:492–494. - PubMed
    1. Ames G F L. Bacterial periplasmic transport systems: structure, mechanism, and evolution. Annu Rev Biochem. 1986;55:397–425. - PubMed
    1. Atlung T, Brondsted L. Role of the transcriptional activator AppY in regulation of the cyx appA operon of Escherichia coli by anaerobiosis, phosphate starvation and growth phase. J Bacteriol. 1994;176:5414–5422. - PMC - PubMed
    1. Bagg A, Neilands J. Molecular mechanism of regulation of siderophore-mediated iron assimilation. Microbiol Rev. 1987;51:509–518. - PMC - PubMed
    1. Bagg A, Neilands J B. Ferric uptake regulation protein acts as a repressor, employing iron(II) as a cofactor to bind the operator of an iron transport operon in Escherichia coli. Biochemistry. 1987;26:5471–5477. - PubMed

Publication types

MeSH terms

LinkOut - more resources