. 2001 Mar 1;21(5):1663-75.
doi: 10.1523/JNEUROSCI.21-05-01663.2001.

Organization of olivocerebellar activity in the absence of excitatory glutamatergic input

Affiliations

Organization of olivocerebellar activity in the absence of excitatory glutamatergic input

E J Lang. J Neurosci. .

Abstract

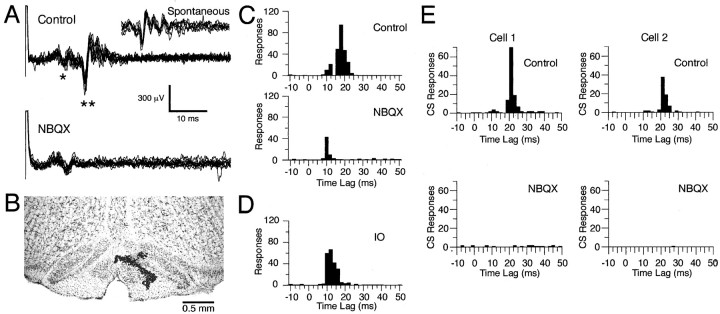
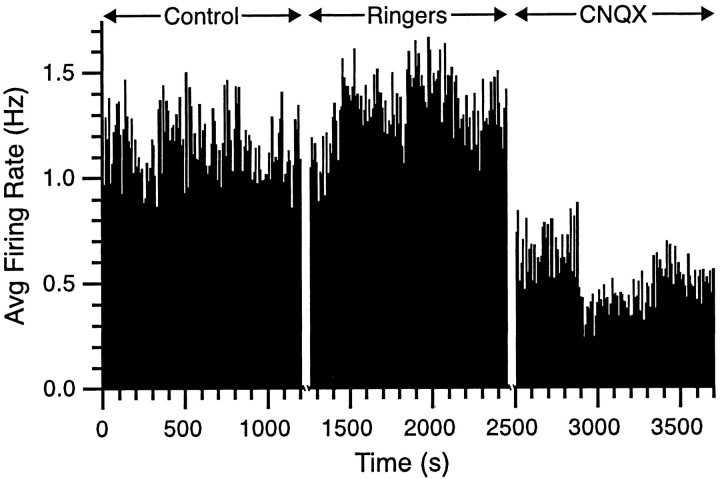
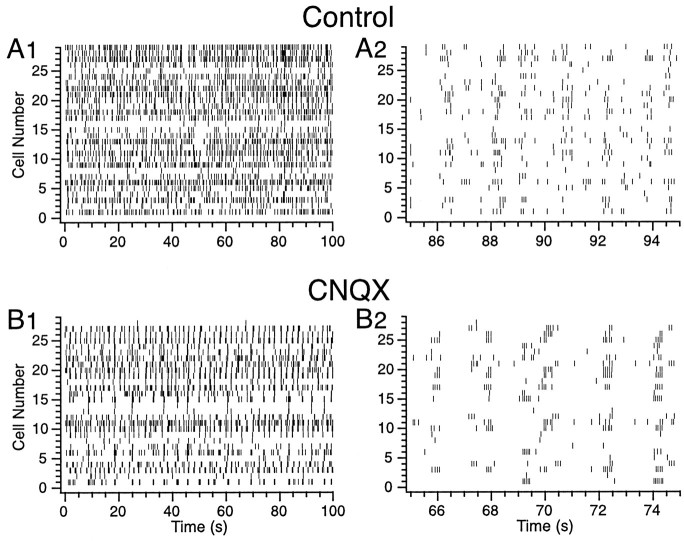
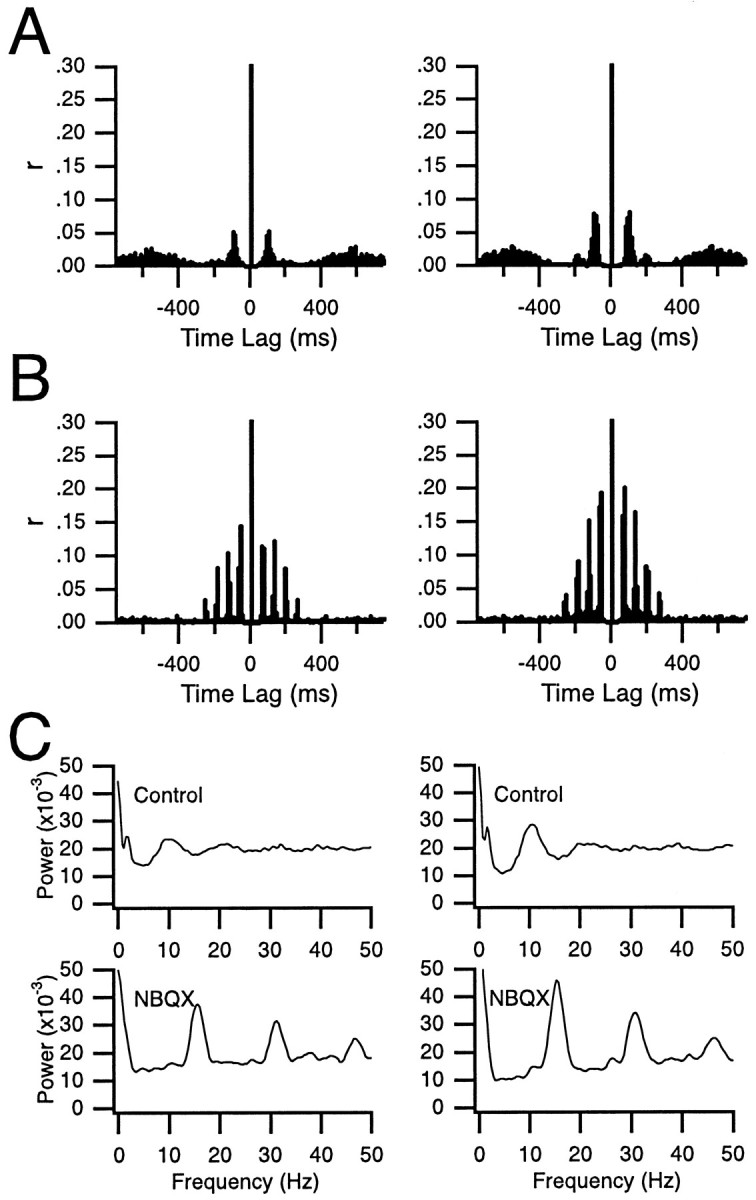
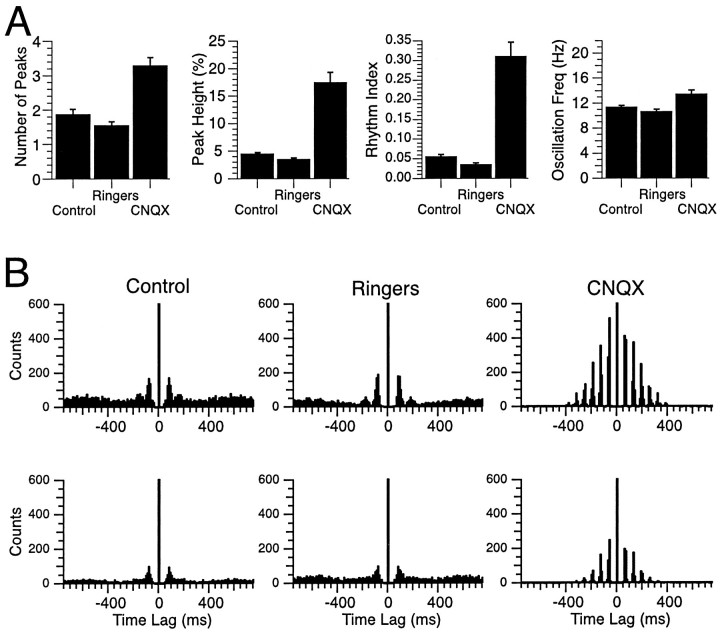
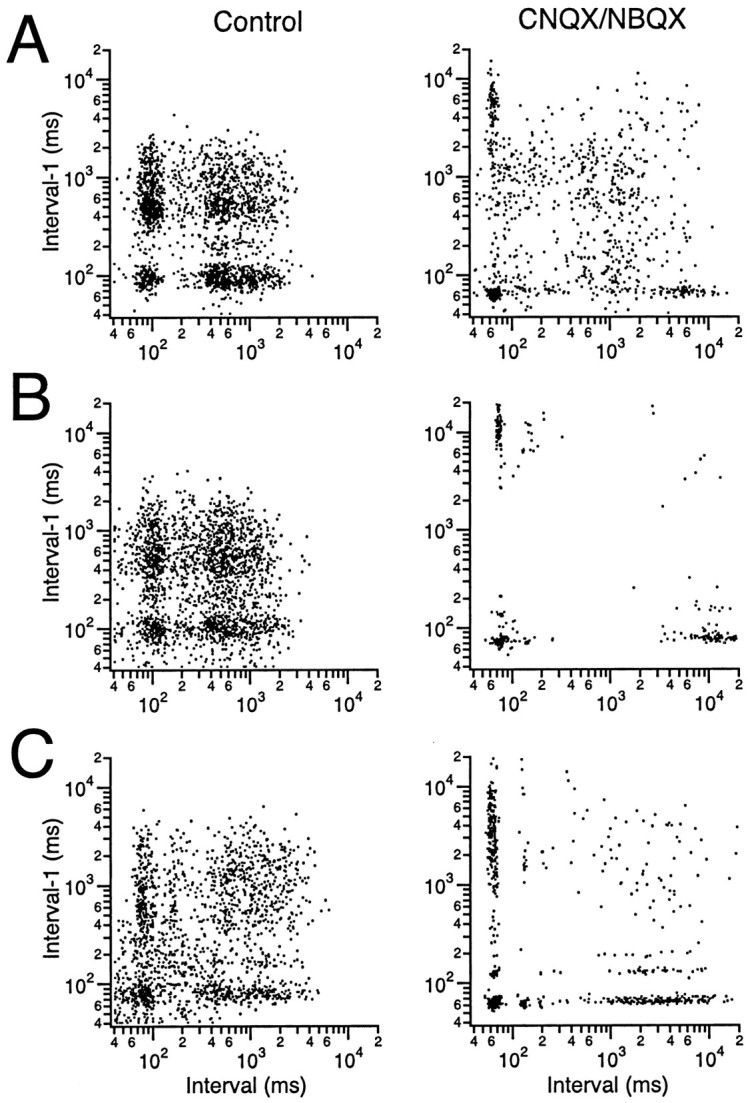
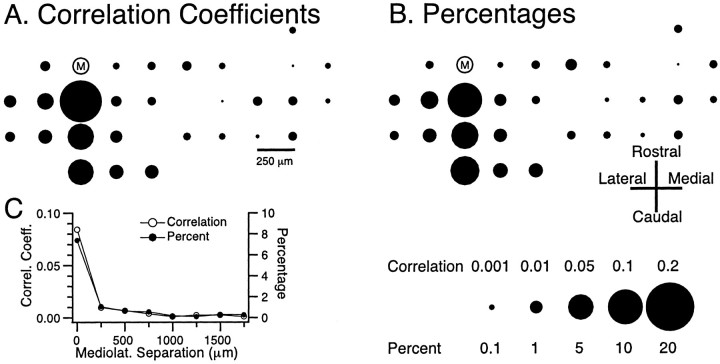
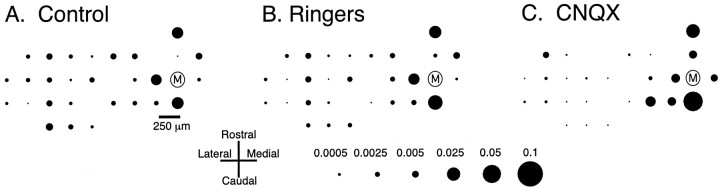
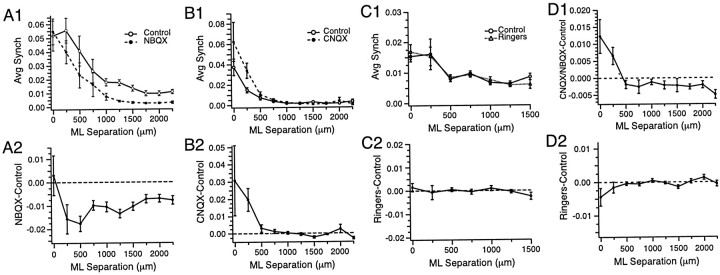
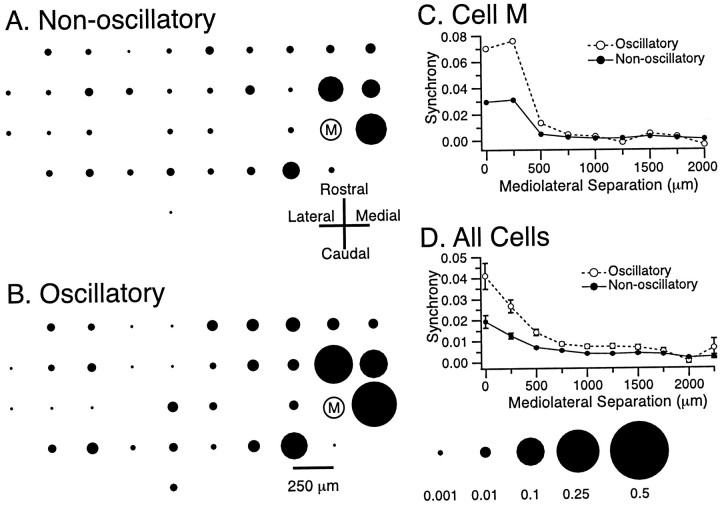
The olivocerebellar system has been proposed to function as a timing device for motor coordination in which inferior olivary neurons act as coupled oscillators that spontaneously generate rhythmic and synchronous activity. However, the inferior olive receives excitatory afferents, which can also drive the activity of these neurons. The extent to which the olivocerebellar system can intrinsically generate synchronous activity and olivary neurons act as neuronal oscillators has not been determined. To investigate this issue, multiple electrode recordings of complex spike (CS) activity were obtained from 236 crus 2a Purkinje cells in anesthetized rats. Intraolivary injections of the glutamate antagonists 6-cyano-7-nitroquinoxaline-2,3-dione or 1,2,3,4-tetrahydro-6-nitro-2,3-dioxo-benzo[f]quinoxaline-7-sulfonamide disodium were made, and the resulting changes in CS activity were determined. Loss of evoked CS responses to motor cortex stimulation or perioral tactile stimulation was used to measure the efficacy of the block. Block of glutamatergic input decreased the average CS firing rate by approximately 50% but did not abolish spontaneous CS activity. The remaining CS activity was significantly more rhythmic than that in control. The patterns of synchrony were similar to those found in control conditions (i.e., synchronous CSs primarily occurred among Purkinje cells located within the same approximately 250-microm-wide rostrocaudally oriented cortical strip); however, this normal banding pattern was enhanced. These changes in CS activity were not observed with vehicle injections. The results suggest that excitatory afferent activity disrupts olivary oscillations and support the hypotheses that olivary neurons are capable of acting as neuronal oscillators and that synchronous CS activity results from electrotonic coupling of olivary neurons.


Figures

Fig. 1.
Fig. 1.
Block of stimulus-evoked olivocerebellar activity by intraolivary injection of glutamate antagonists. A, Extracellular recording of Purkinje cell responses to motor cortical stimuli. In the control condition, motor cortical stimuli (1.5 mA pulse of 200 μsec) evoked an initial triphasic field potential (*) followed by a CS response (**). After injection of NBQX, the CS response is abolished. Responses to 10 stimuli are overlapped in each condition.Inset, Seven overlapped spontaneous CSs demonstrating the similarity in duration and waveform to the evoked CS activity.B, Contrast-enhanced 60-μm-thick coronal section of brainstem counterstained with cresyl violet showing an injection site in the rostral medial portion of the IO. The injection site was marked by a pressure injection of alcian blue dye at the conclusion of the experiment (dark spots within the IO). C, Peristimulus histograms of Purkinje cell activity (same cell shown inA) evoked by motor cortical stimulation.D, Peristimulus histogram of multiunit recording of IO activity from the same control condition shown in C. Histograms in C and D were compiled from responses to 300 stimuli. E, Peristimulus histograms showing CS responses of two cells to brief jabs applied to the upper lip with a stylus before (Control) and after (NBQX) intraolivary injection of NBQX. Histograms were generated from the CS responses during 600 trials (intertrial period was 1 sec). Bin size equals 2 msec.
Fig. 2.
Fig. 2.
Spontaneous CS activity decreases with intraolivary CNQX injections. The rate meter was calculated from an experiment in which 29 cells were simultaneously recorded. The rate meter shows the single-cell firing rate averaged over the 29 cells for successive 10 sec intervals during three 20 min recording conditions (Control, Ringers,CNQX). Time is continuous within each recording condition but not between conditions (i.e., there was a 10–15 min period between each recording condition to exchange the solution of the injection pipette). Avg, Average.
Fig. 3.
Fig. 3.
Raster displays of CS activity during control (A1, A2) and after intraolivary injection of CNQX (B1, B2). In this experiment, CS activity was recorded from 29 Purkinje cells simultaneously. Eachhorizontal row of tick marks represents the CS activity from a single Purkinje cell. Note the decrease in overall activity induced by the injection and the change in the pattern of activity (A vs B). The details of the shift in firing pattern induced by the CNQX injection are illustrated by rasters with an expanded time scale (A2,B2).
Fig. 4.
Fig. 4.
Increase in CS rhythmicity after intraolivary NBQX injection. A, B, Normalized autocorrelograms of the CS activity recorded from two Purkinje cells during a 20 min control period (A) and during a 20 min period after block of glutamatergic input to the inferior olive by NBQX (B). The centralpeaks are truncated in A andB. C, FFTs of the autocorrelograms shown in A (top) and B(bottom) illustrating the shift in oscillation frequency from 10 Hz in control to 15 Hz after injection of NBQX. Eachcolumn shows histograms and FFTs from one cell.
Fig. 5.
Fig. 5.
Injections of CNQX but not Ringer's solution alter CS rhythmicity. A, The characteristics of CS rhythmicity were quantified using several measures: number of peaks, peak height, rhythm index, and oscillation frequency. The histograms compare the mean value ± SEM of these measures in control and after injection of Ringer's solution and CNQX in the same animals. Histograms are based on CS activity recorded from 52 Purkinje cells in two animals. B, Autocorrelograms of CS activity from two Purkinje cells recorded under all three conditions illustrate the similarity of the CS activity during injection of Ringer's solution to that in control conditions and the dramatic change induced by CNQX injections. Note that the centralpeaksare truncated. All recording sessions (Control,Ringers, CNQX) were 20 min in duration. Freq, Frequency.
Fig. 6.
Fig. 6.
CS activity displays distinct firing modes. Scatter plots were generated by plotting each interspike interval (x-axis) against the previous interspike interval (y-axis). Plots from three cells (A–C) under control conditions (left column) and after intraolivary injection of either CNQX or NBQX (right column) are shown to illustrate the typical patterns that were observed. All plots were generated from 20 min recording sessions.
Fig. 7.
Fig. 7.
Spatial organization of CS synchrony.A, B, Spatial distribution of CS synchrony with regard to reference cell M, as measured by cross-correlation coefficients (A) and by the percentage of synchronous spikes of cell M with each of the other simultaneously recorded cells (B). In each case (correlation coefficients, percentages) the positions of thecircles represent the relative positions of the recording electrodes on crus 2a. The area of each circleis proportional to the degree of synchrony between cell M and the cell located at that position. Scale at bottom right of figure gives calibration for both measures. C, The average level of synchronization between cell M and other cells plotted as a function of the mediolateral separation between the cells. Bin size equaled 1 msec for all analyses, and session duration was 20 min.Correl. Coeff., Correlation coefficient;Mediolat., mediolateral.
Fig. 8.
Fig. 8.
Complex spike synchrony persists after intraolivary CNQX injections. Spatial maps of synchronous CS activity with respect to cell M in control (A) and during injection of Ringer's solution (B) and CNQX (C) to the inferior olive. Circlesrepresent the positions of the recording electrodes on crus 2a. The area of each circle is proportional to the synchrony (i.e., zero-time cross-correlation coefficient) between the CS activity of the cell located at that position and the CS activity of cell M. Time bin for analysis was 1 msec. Recording periods were 20 min for each condition. Scale at bottom gives calibration forA–C.
Fig. 9.
Fig. 9.
Effect of CNQX or NBQX injections on the spatial distribution of CS synchrony. A1, B1, C1, The average level of CS synchrony plotted as a function of the mediolateral separation distance between cell pairs for three experiments in which NBQX (A1), CNQX (B1), or Ringer's solution (C1) was injected into the inferior olive. The plots were generated by calculating the level of synchrony (zero-time cross-correlation coefficient) for all cell pairs and then sorting the pairs according to the mediolateral distance separating the cells.A2, B2, C2, Plots of the corresponding differences in synchrony between the two conditions in each experiment.D1, Plots of synchrony differences between the CNQX or NBQX condition and control as a function of mediolateral separation for all cells in seven experiments. D2, Same as D1 for synchrony differences between Ringer's solution and control conditions. Error bars are SEM. Time bin for analysis was 1 msec. Recording periods were 20 min for each condition. ML, Mediolateral.
Fig. 10.
Fig. 10.
Enhancement of the banding pattern of synchronous CS activity during rhythmic firing. A, B, Spatial pattern of CS synchrony with regard to cell M while cell M was displaying nonoscillatory (A) and oscillatory (B) CS activity. Note the preferential increase in synchronization for cells located close to cell M. Scale atbottom right of figure gives calibration forA and B. C, The average level of synchrony between cell M and the other cells plotted as a function of the mediolateral separation distance between cell M and the compared cell for the periods when cell M displayed oscillatory (open circles) and nonoscillatory (filled circles) CS activity. D, Plot of average level of synchrony as a function of mediolateral separation between the cells in each pair. The average was obtained by considering all possible cell pairs. Error bars are SEM.

References

    1. Allen GI, Azzena GB, Ohno T. Cerebellar Purkinje cell responses to inputs from sensorimotor cortex. Exp Brain Res. 1974;20:239–254. - PubMed
    1. Ambalavanar R, Ludlow CL, Wenthold RJ, Tanaka Y, Damirjian M, Petralia RS. Glutamate receptor subunits in the nucleus of the tractus solitarius and other regions of the medulla oblongata in the cat. J Comp Neurol. 1998;402:75–92. - PubMed
    1. Bal T, McCormick DA. Synchronized oscillations in the inferior olive are controlled by the hyperpolarization-activated cation current Ih. J Neurophysiol. 1997;77:3145–3156. - PubMed
    1. Bell CC, Kawasaki T. Relations among climbing fiber responses of nearby Purkinje cells. J Neurophysiol. 1972;35:155–169. - PubMed
    1. Benardo LS, Foster RE. Oscillatory behavior in inferior olive neurons: mechanisms, modulation, cell aggregates. Brain Res Bull. 1986;17:773–784. - PubMed

Publication types

MeSH terms

Substances

LinkOut - more resources