. 2001 Mar 1;21(5):1795-808.
doi: 10.1523/JNEUROSCI.21-05-01795.2001.

Long-range cortical synchronization without concomitant oscillations in the somatosensory system of anesthetized cats

Affiliations

Long-range cortical synchronization without concomitant oscillations in the somatosensory system of anesthetized cats

S A Roy et al. J Neurosci. .

Abstract

To determine whether neuronal oscillations are essential for long-range cortical synchronization in the somatosensory system, we characterized the incidence and response properties of gamma range oscillations (20-80 Hz) among pairs of synchronized neurons in primary (SI) and secondary (SII) somatosensory cortex. Synchronized SI and SII discharges, which occurred within a 3 msec period, were detected in 13% (80 of 621) of single-unit pairs and 25% (29 of 118) of multiunit pairs. Power spectra derived from the auto-correlation histograms (ACGs) revealed that approximately 15% of the neurons forming synchronized pairs were characterized by oscillations. Although 24% of the synchronized neuron pairs (19/80) were characterized by oscillations in one or both neurons, only 1% (1/80) of these pairs displayed oscillations at the same frequency in both neurons. Similar results were observed among pairs of multiunit responses. When single-trial responses were analyzed, the vast majority of responses still did not exhibit oscillations in the gamma frequency range. These results suggest that separate populations of cortical neurons can be bound together without being constrained by the phase relationships defined by specific oscillatory frequencies.


Figures
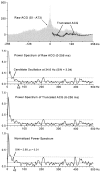
Fig. 1.
Fig. 1.
Method for detecting neuronal oscillations.Top panel, Raw and truncated ACGs for a spike train recorded in SI (A73). With the exception of the impulse peak at time 0, the same rhythmic patterns are present in both the raw and truncated ACGs. Second panel, Power spectrum of the raw ACG contains a large DC component that gradually merges into the gamma frequency range (20–80 Hz). Although power fluctuates randomly around the noise level (dashed line) at frequencies >65 Hz (arrowhead), a peak at 34.6 Hz exceeded the confidence limits (dotted line) and had a signal-to-noise ratio of 3.04. This small peak may have exceeded the confidence limits because it was superimposed on the trailing edge of an elevated low-frequency trend. Third panel, Power spectrum of the truncated ACG contained a much smaller DC component, but the low-frequency trend was still present. Bottom panel, The normalized power spectrum contained fluctuations around the noise level at frequencies as low as 42 Hz (arrowhead). After normalization, the small peak at 34.6 Hz failed to exceed the confidence limits, and its signal-to-noise ratio decreased to 2.68. Statistical analysis indicated that the distribution of values in the gamma frequency range of the normalized power spectrum was not significantly different from a Gaussian white noise distribution having the same mean value (KS test;p > 0.01).
Fig. 2.
Fig. 2.
Synchronized activity in a pair of SI and SII neurons in which one neuron contained weak oscillations in the gamma frequency range. A, Extracellular waveforms and receptive fields for a pair of simultaneously recorded neurons in experiment A151. The waveforms represent the average shape of all discharges recorded during spontaneous and stimulus-induced activity as shown in B. Trace duration: 1.5 msec; calibration: 50 μV for SII, 100 μV for SI. Drawing of the distal forepaw illustrates the trajectory of the 1 Hz moving air jet as it crosses the overlapping receptive fields of each neuron. B, PSTHs illustrating spontaneous and stimulus-induced responses across 300 trials. The arrows below the bottom PSTH illustrate the back-and-forth motion of the air jet as it repeats three consecutive 1 Hz cycles. Bin widths, 25 msec. C, Raw (top) and shift-corrected (bottom) CCGs displaying correlated discharges recorded during spontaneous and stimulus-induced activity. Dotted lines in the shift-corrected CCGs indicate 99% confidence limits. Bin widths, 1.0 msec. D, Raw ACGs (left) constructed from stimulus-induced responses during the moving air jet. Although the ACGs were constructed over lag intervals of 256 msec, only the first 128 msec are displayed to facilitate detection of oscillations occurring in the gamma frequency range (20–80 Hz). Neuron SI-A151contains a small peak at 14–24 msec that corresponds to a frequency of 41–71 Hz. Analysis of the power spectra (right) derived from the truncated ACGs revealed a significant oscillatory component at 46.8–58.6 Hz (KS test; p < 0.007) for neuronSI-A151. ACG bin widths, 1.0 msec; power spectra bin widths, 3.9 Hz. Dashed and dotted linesin the power spectra indicate mean noise and confidence limits (i.e., mean noise plus 3 SDs), respectively.
Fig. 3.
Fig. 3.
Synchronized activity in a pair of SI and SII neurons (A-41) that did not oscillate in the gamma frequency range (20–80 Hz). Neuronal waveforms, receptive fields, and temporal patterns of spontaneous and stimulus-induced activity are illustrated as in Figure 2. In A, the waveform traces represent a duration of 1.2 msec, and the calibration bar represents 100 μV for both waveforms. The clear difference in the waveform patterns indicates that the temporal precision of synchronized activity (see C) was not caused by electrical artifacts.
Fig. 4.
Fig. 4.
Synchronized multiunit responses in SI and SII (A-130) without concomitant oscillations. Temporal patterns of spontaneous and stimulus-induced multiunit responses are illustrated as in Figures 2 and 3. As indicated by the ACGs and power spectra in D, stimulus-induced responses in both SI and SII were devoid of oscillations in the gamma frequency range (20–80 Hz).
Fig. 5.
Fig. 5.
Cumulative distributions illustrating the strength of spontaneous and stimulus-induced synchronization across SI and SII. Data are based on 80 pairs of single neurons and 29 pairs of multiple neurons in which significant peaks appeared in the neural CCGs of the stimulus-induced responses. Maximum synchronization strength for each group is indicated by filled and unfilled triangles appearing along the bottom axis.
Fig. 6.
Fig. 6.
Precision of temporal synchronization for single-unit and multiunit stimulus-induced responses in SI and SII.Left panel, Distribution of peak half widths for pairs of synchronized single and multiple neuron responses. A peak half width is defined as the temporal width of a peak in the neural CCG at half its height. Right panel, Distribution of neural CCG peak times with respect to time 0.
Fig. 7.
Fig. 7.
Distribution of neuronal oscillations according to frequency. Stimulus-induced neuronal responses that exhibited significant levels of oscillations in the gamma frequency range are represented according to their tallest peak in the power spectrum derived from the ACG. Bin widths appear as 4 Hz increments to correspond with the frequency resolution of the power spectra.
Fig. 8.
Fig. 8.
Strength of neuronal oscillations. Eachbar represents the mean signal-to-noise ratio for significant oscillations detected in the gamma frequency range of the power spectrum. Noise was calculated as the average power level in the 250–500 Hz range. Error bars indicate SEM.
Fig. 9.
Fig. 9.
Strength of synchronized activity in SI and SII as a function of the presence or absence of oscillations in the constituent neuronal responses. Left panel, Mean synchronization rate for single-unit or multiunit pairs in which oscillations were detected in neither neuronal response, in one neuronal response, or in both neuronal responses as indicated by thelegend. Right panel, Mean magnitude of correlation coefficients for the same groups shown in the left panel. Error bars indicate SEM.
Fig. 10.
Fig. 10.
Trial-by-trial analysis of oscillatory responses in experiment A130. These trials illustrate the strongest oscillations (in terms of signal-to-noise ratio) that were detected among 100 trials, the summed multiunit responses of which are illustrated in Figure 4. The ACGs and power spectra represent the temporal structure of activity recorded simultaneously from SI (left) and SII (right) during specific trials as indicated.Arrows indicate peaks in the power spectra that represent significant oscillations in the gamma frequency range.Solid and dashed horizontal linesrepresent mean noise (from 250 to 500 Hz) or mean noise plus 3 SDs, respectively. Visual inspection of all 200 ACGs revealed gamma range oscillations in SI on trials 39 and 49, and in SII on trial 58.
Fig. 11.
Fig. 11.
Neural CCGs illustrating the degree of synchronization in experiment A130 for those trials classified as containing no oscillations (n = 59), oscillations in SI only (n = 8), oscillations in SII only (n = 29), or oscillations in both cortical areas (n = 4). Because of differences in the number of trials, the CCGs are scaled so that the 99% confidence limits span approximately the same distance in each histogram.
Fig. 12.
Fig. 12.
Detectability of oscillations occurring on intermittent trials. Simulated ACGs containing oscillatory activity at varying strengths were systematically combined with Gaussian white noise ACGs to determine the number of oscillatory trials needed to detect a significant frequency in a power spectrum computed across the entire block of trials. Simulated ACGs are shown from 0–128 msec, with the mean bin height set at 25 events per bin for each trial.

Similar articles

Cited by

References

    1. Aertsen AMHJ, Gerstein GL, Habib MK, Palm G. Dynamics of neuronal firing correlation: modulation of “effective connectivity.”. J Neurophysiol. 1989;61:900–917. - PubMed
    1. Ahissar M, Ahissar E, Bergman H, Vaadia E. Encoding of sound-source location and movement: activity of single neurons and interactions between adjacent neurons in the monkey auditory cortex. J Neurophysiol. 1992;67:203–215. - PubMed
    1. Alloway KD, Burton H. Homotypical ipsilateral cortical projections between somatosensory areas I and II in the cat. Neuroscience. 1985;14:15–35. - PubMed
    1. Alloway KD, Johnson MJ, Aaron GB. A comparative analysis of coordinated neuronal activity in the thalamic ventrobasal complex of rats and cats. Brain Res. 1995;691:46–56. - PubMed
    1. Alloway KD, Wallace MB, Johnson MJ. Cross-correlation analysis of cuneothalamic interactions in the rat somatosensory system: influence of receptive field topography and comparisons with thalamocortical interactions. J Neurophysiol. 1994;72:1949–1972. - PubMed

Publication types

LinkOut - more resources