. 2001 Mar;75(6):2665-74.
doi: 10.1128/JVI.75.6.2665-2674.2001.

Increased expression of MIP-1 alpha and MIP-1 beta mRNAs in the brain correlates spatially and temporally with the spongiform neurodegeneration induced by a murine oncornavirus

Affiliations

Increased expression of MIP-1 alpha and MIP-1 beta mRNAs in the brain correlates spatially and temporally with the spongiform neurodegeneration induced by a murine oncornavirus

S Askovic et al. J Virol. 2001 Mar.

Abstract

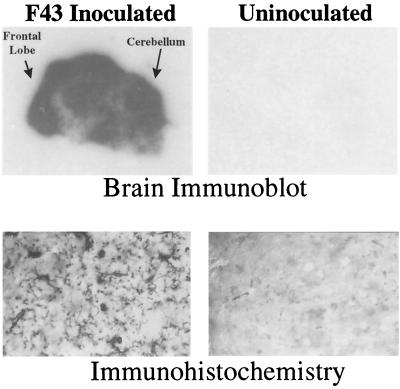
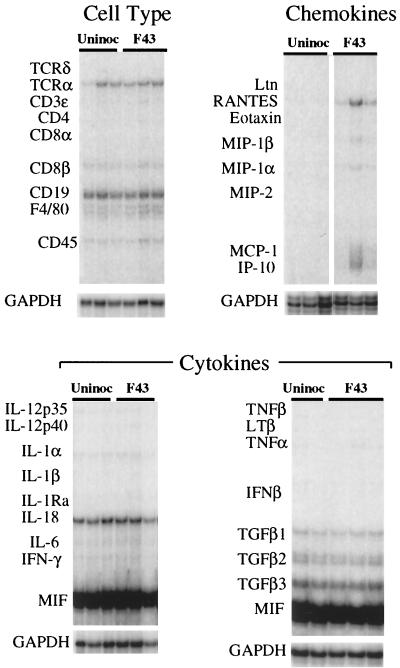
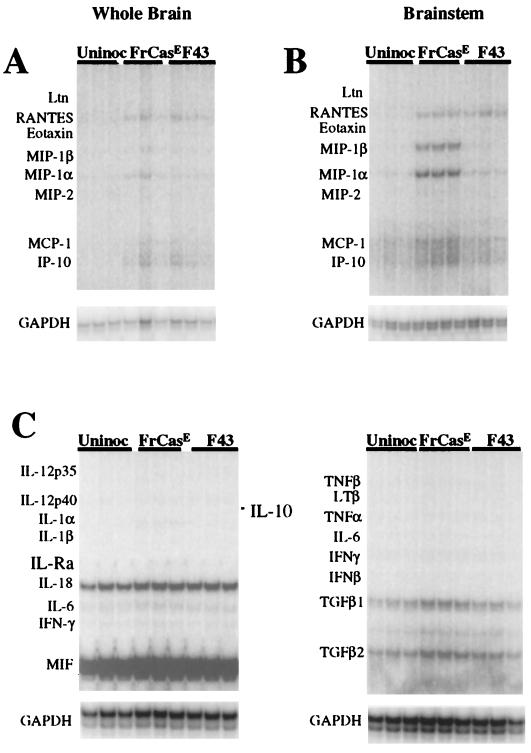
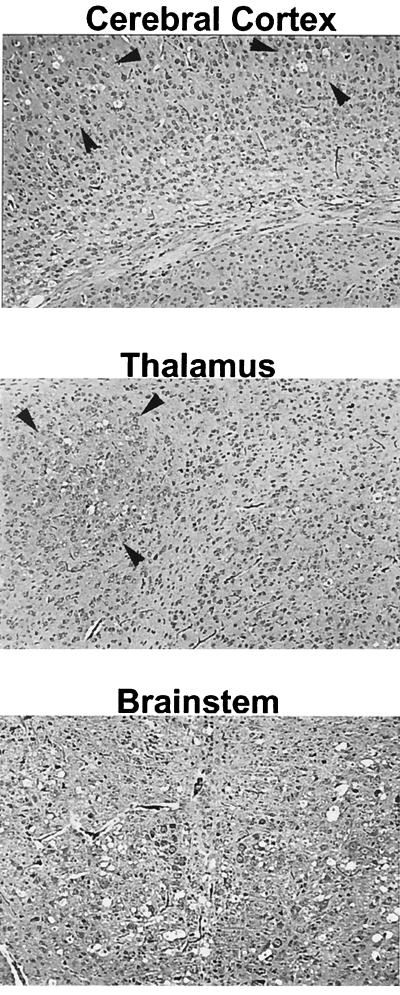
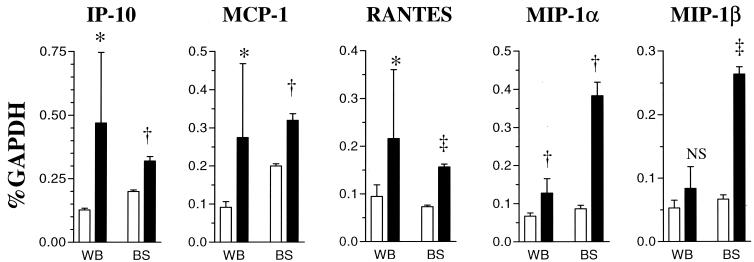
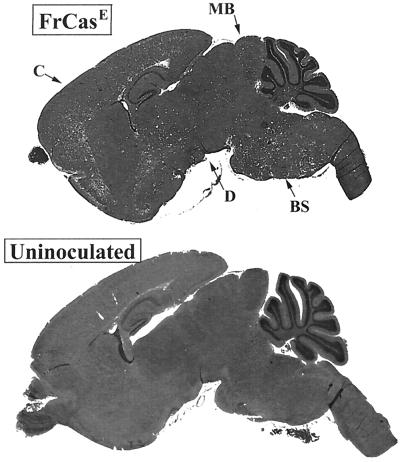
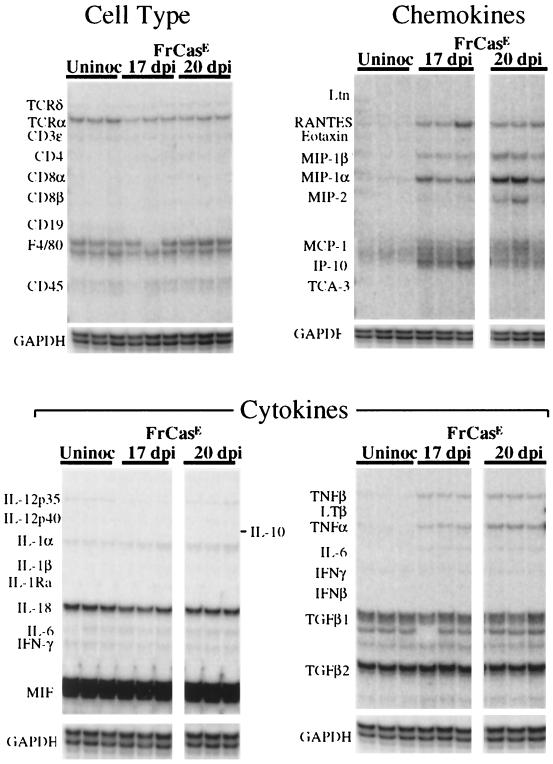
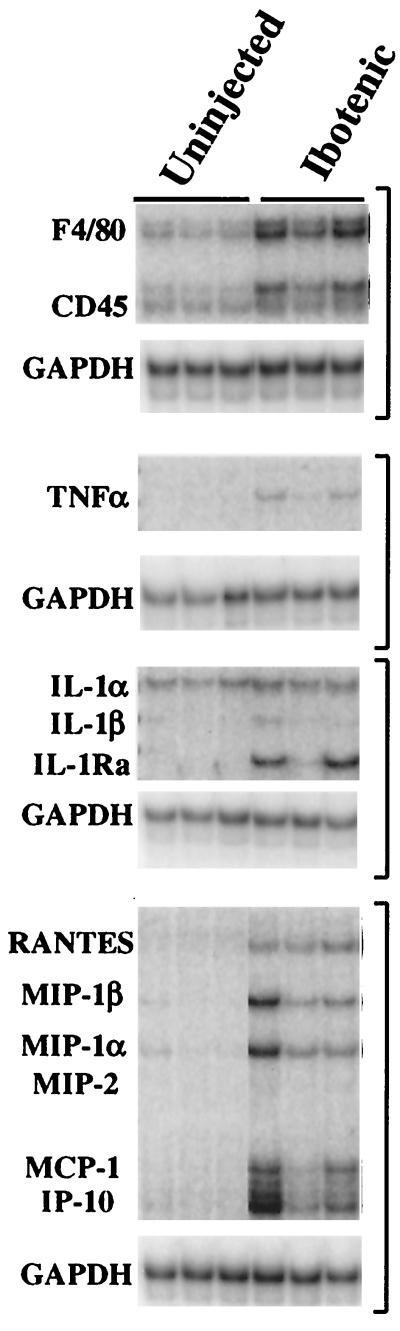
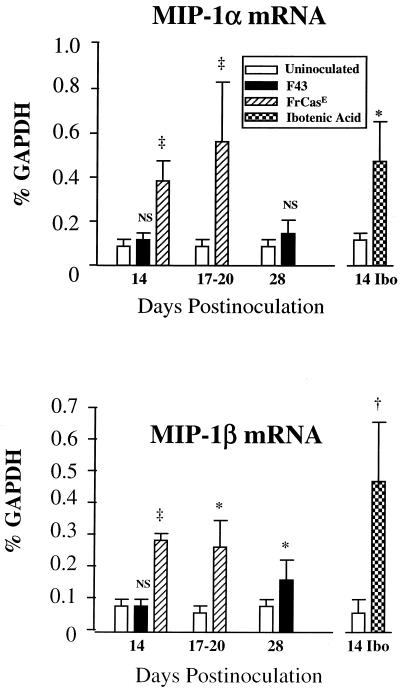
The chimeric murine oncornavirus FrCas(E) causes a rapidly progressive paralytic disease associated with spongiform neurodegeneration throughout the neuroaxis. Neurovirulence is determined by the sequence of the viral envelope gene and by the capacity of the virus to infect microglia. The neurocytopathic effect of this virus appears to be indirect, since the cells which degenerate are not infected. In the present study we have examined the possible role of inflammatory responses in this disease and have used as a control the virus F43. F43 is an highly neuroinvasive but avirulent virus which differs from FrCas(E) only in 3' pol and env sequences. Like FrCas(E), F43 infects large numbers of microglial cells, but it does not induce spongiform neurodegeneration. RNAase protection assays were used to detect differential expression of genes encoding a variety of cytokines, chemokines, and inflammatory cell-specific markers. Tumor necrosis factor alpha (TNF-alpha) and TNF-beta mRNAs were upregulated in advanced stages of disease but not early, even in regions with prominent spongiosis. Surprisingly there was no evidence for upregulation of the cytokines interleukin-1 alpha (IL-1 alpha), IL-1 beta, and IL-6 or of the microglial marker F4/80 at any stage of this disease. In contrast, increased levels of the beta-chemokines MIP-1 alpha and -beta were seen early in the disease and were concentrated in regions of the brain rich in spongiosis, and the magnitude of responses was similar to that observed in the brains of mice injected with the glutamatergic neurotoxin ibotenic acid. MIP-1alpha and MIP-1beta mRNAs were also upregulated in F43-inoculated mice, but the responses were three- to fivefold lower and occurred later in the course of infection than was observed in FrCas(E)-inoculated mice. These results suggest that the robust increase in expression of MIP-1 alpha and MIP-1 beta in the brain represents a correlate of neurovirulence in this disease, whereas the TNF responses are likely secondary events.


Figures

FIG. 1
FIG. 1
Extent of infection of the brain 28 days after intraperitoneal inoculation of neonates with the avirulent virus F43. Top panels, immunoblots of midsaggital sections of freshly frozen brain from an inoculated mouse (left panel) and an age-matched uninoculated control (right panel). Sections were blotted onto polyvinylidene fluoride membranes and probed with a goat anti-viral SU protein; bound antibody was visualized using a chemiluminsecent substrate and exposed to X-ray film (see Materials and Methods). Bottom panels, a more detailed high-power view of infected and uninfected brains. Frozen sections of formaldehyde-fixed, cryopreserved brains were stained by routine immunohistochemistry using the same anti-SU antiserum and developed with the dark-blue colored substrate VIP (Vector). These sections were not counterstained, and thus all dark-stained structures in the left panel represent virus-specific signals. This web-like array of microglia expressing SU protein was seen throughout the infected brain. These cells have been shown previously to stain with the microglia-specific antibody F4/80 (3).
FIG. 2
FIG. 2
Expression of genes associated with inflammatory responses in the brains of mice 28 days after neonatal intraperitoneal inoculation of the avirulent virus F43. Total RNA extracts of the brains of F43-infected and age-matched uninfected controls were analyzed by multiprobe RPA, and the autoradiograms are shown. The locations of the protected probes for inflammatory-cell-specific markers, chemokines, and cytokines are shown on the left of each panel. The signals for the GAPDH housekeeping gene for each lane are shown below each panel. Three mice are shown per group, except in the lower right panel, in which only two uninoculated controls (Uninoc) are shown. Despite the high-level and widespead infection of the brain by F43, only the mRNA species of the β-chemokines RANTES, MIP-1β, MIP-1α, and MCP-1 were variably elevated. There was no evidence for upregulation of any of the other transcripts analyzed. TCR, T-cell receptor, TGF, transforming growth factor, IFN, interferon.
FIG. 3
FIG. 3
Comparison of RPA analyses of whole brains (A) and brain stems (B) from mice 14 dpi with the virulent virus FrCasE, the avirulent virus, F43 and age-matched uninoculated controls (Uninoc). At this early time point in the disease, MIP-1α and MIP-1β mRNA were specifically elevated in the brain stems of FrCasE-infected mice. MCP-1 was also marginally elevated, whereas RANTES was increased in both FrCasE and F43 inoculated mice. (C) Brain stem RNA analyzed by RPA for cytokine transcripts. There was no evidence for upregulation of these genes in either group of infected mice. TGF, transforming growth factor; IFN, interferon.
FIG. 4
FIG. 4
Photomicrographs of sections of various areas of the CNS 14 dpi with FrCasE. Focal spongiosis (holes), delineated by arrowheads, are seen in the cerebral cortex and thalamus. In the brain stem, however, spongiosis was already diffuse, with holes being seen throughout the entire photomicrograph. Hematoxylin and eosin staining was used. Magnification before enlargement, ×25.
FIG. 5
FIG. 5
Enrichment of transcripts for MIP-1α and MIP-1β in the brain stems of FrCasE-inoculated mice. Quantitative analysis of chemokine mRNA levels are shown for whole brains (WB) and brain stems (BS) of mice 14 dpi with FrCasE (black bars). Age-matched uninoculated mice were the controls (white bars). Bands were quantified with a phosphorimager and normalized as a percentage of the GAPDH mRNA signal. For whole brain samples there were seven uninoculated and eight inoculated mice per group. For brain stem samples there were three mice per group. For statistical analyses, each group of inoculated mice was compared to the respective uninoculated controls. ∗, <0.05; †, <0.01; ‡, <0.001; NS, not significant.
FIG. 6
FIG. 6
(Top) Midsaggital section of the brain of a mouse in the terminal stage of neurologic disease caused by neonatal inoculation of FrCasE. This mouse was killed 20 dpi with virus diluted 10−4. (Bottom) A comparable section of an uninoculated control mouse is shown for comparison. The white dots in the FrCasE-infected brain represent spongiform degeneration, which is extensive at this stage, being seen in the cerebral cortex (C), diencephalon (D), midbrain (MB), and brain stem (BS) regions.
FIG. 7
FIG. 7
Expression of genes associated with inflammatory responses in the brains of mice with advanced neurologic disease. All mice were preterminal, with severe tremor and both hind- and forelimb paralysis. Mice were killed 17 days after neonatal inoculation of FrCasE or 20 days after inoculation of diluted FrCasE, and RNA was extracted from whole brains. RPA analysis shows, in addition to the chemokines found to be upregulated at 14 dpi (upper right panel), the upregulation of TNF-α and TNF-β (lower right panel) as well as the chemokine MIP-2. It should be noted, however, that even at this late time point in the disease, there was no evidence for increased expression of other cytokine genes, including those for the IL-1 family or gamma interferon (IFNγ) (lower panels). IL-6 appeared to be marginally increased in the infected groups (lower right panel), but this response was not seen consistently (lower left panel). In addition, there was no evidence for increased expression of inflammatory-cell-specific markers (upper left panel). Note the constitutive expression of T-cell receptor α (TCRα) in the brains of all mice (see Discussion). TGF, transforming growth factor.
FIG. 8
FIG. 8
RPA analysis of frontal lobes 4 days after intracerebral injection of 10 μg of ibotenic acid. a glutamatergic neurotoxin. Mice were injected on postnatal day 11 and sacrificed on postnatal day 15. Shown are those genes which were upregulated in the treated group. TNF-α and the same chemokines found to be upregulated in FrCasE-inoculated mice were also upregulated in the ibotenic acid-treated mice. In addition, however, F4/80, CD45, and IL-1Ra mRNA levels were increased in the ibotenic acid-treated mice. These genes were never found to be upregulated in FrCasE-infected mice, even in those mice with advanced disease.
FIG. 9
FIG. 9
MIP-1α and MIP-1β mRNA responses to FrCasE infection were three- to fivefold greater than those induced by F43 and were comparable to the responses measured in mice injected with ibotenic acid. Shown are compilations of quantitative determinations of the relative levels of these mRNA species found in brain stem 14 days postinoculation and in whole brain extracts 17 to 20 days and 28 days postinoculation. For comparison, the levels of MIP-1α and MIP-1β mRNAs in frontal lobes of 15-day-old mice injected intracerebrally 4 days earlier with ibotenic acid were quantified. The numbers of mice per group ranged from three to eight. Symbols representing P values are defined in the legend to Fig. 5.

References

    1. Andrews J M, Gardner M B. Lower motor neuron degeneration associated with type C RNA virus infection in mice: neuropathological features. J Neuropathol Exp Neurol. 1974;33:285–307. - PubMed
    1. Asensio V C, Kincaid C, Campbell I L. Chemokines and the inflammatory response to viral infection in the central nervous system with a focus on lymphocytic choriomeningitis virus. J Neurovirol. 1999;5:65–75. - PubMed
    1. Askovic S, McAtee F J, Favara C, Portis J L. Brain infection by neuroinvasive but avirulent murine oncornaviruses. J Virol. 2000;74:465–473. - PMC - PubMed
    1. Bell M D, Taub D D, Perry V H. Overriding the brain's intrinsic resistance to leukocyte recruitment with intraparenchymal injections of recombinant chemokines. Neuroscience. 1996;74:283–292. - PubMed
    1. Betmouni S, Perry V H, Gordon J L. Evidence for an early inflammatory response in the central nervous system of mice with scrapie. Neuroscience. 1996;74:1–5. - PubMed

MeSH terms