. 2001 Feb;13(2):385-98.
doi: 10.1105/tpc.13.2.385.

Tuberization in potato involves a switch from apoplastic to symplastic phloem unloading

Affiliations

Tuberization in potato involves a switch from apoplastic to symplastic phloem unloading

R Viola et al. Plant Cell. 2001 Feb.

Abstract

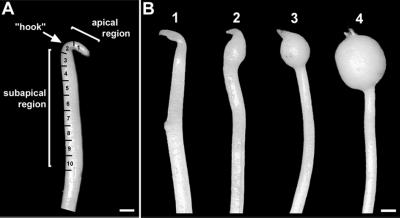
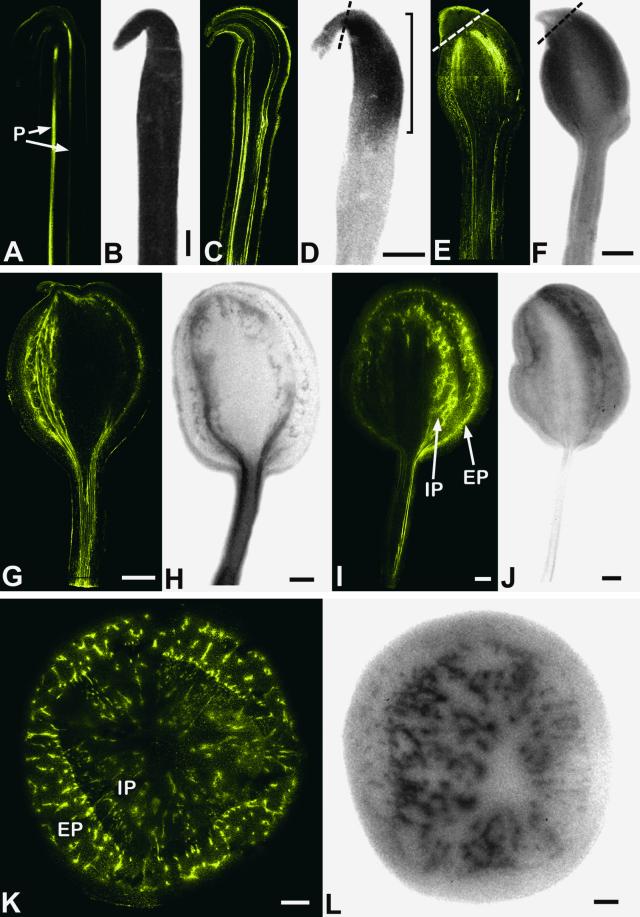
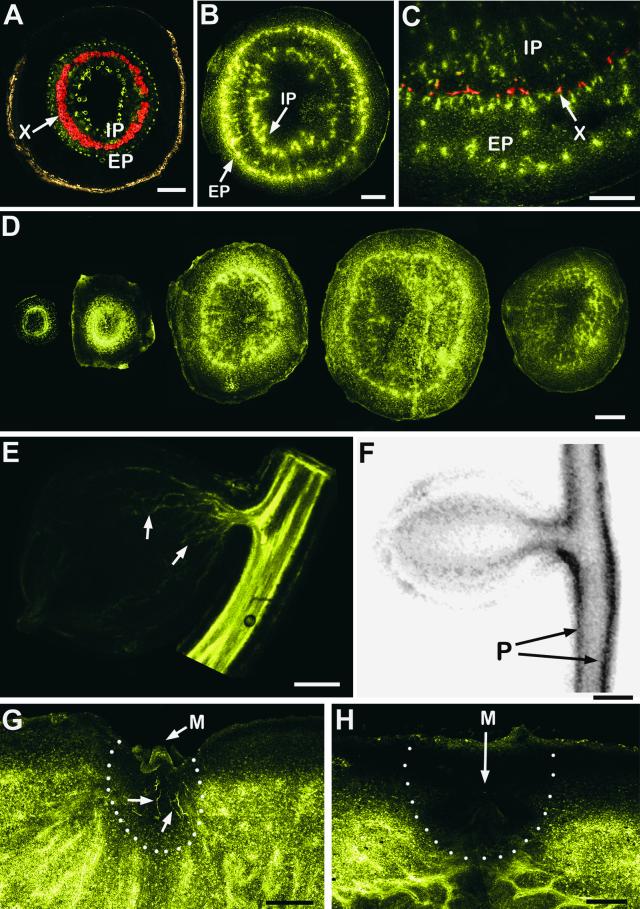
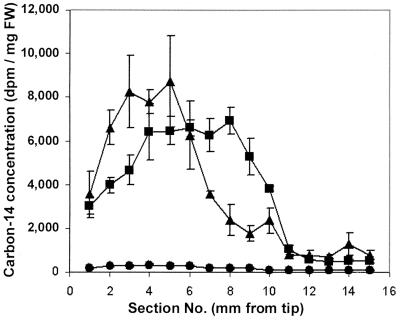
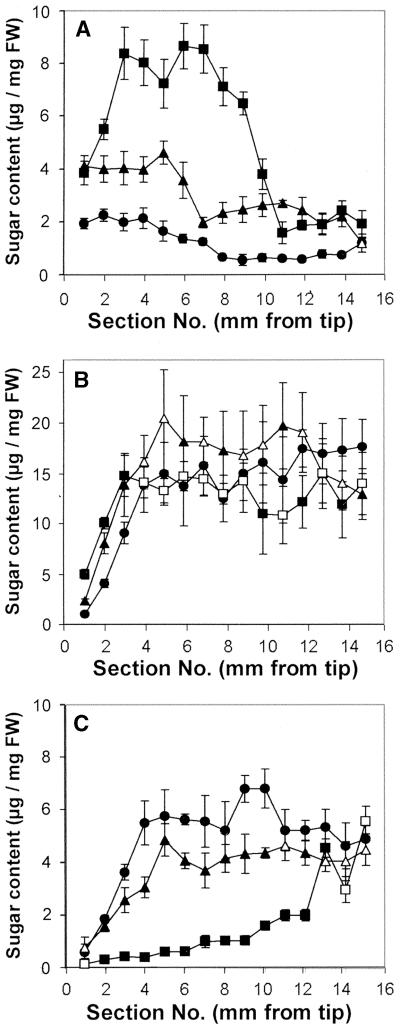
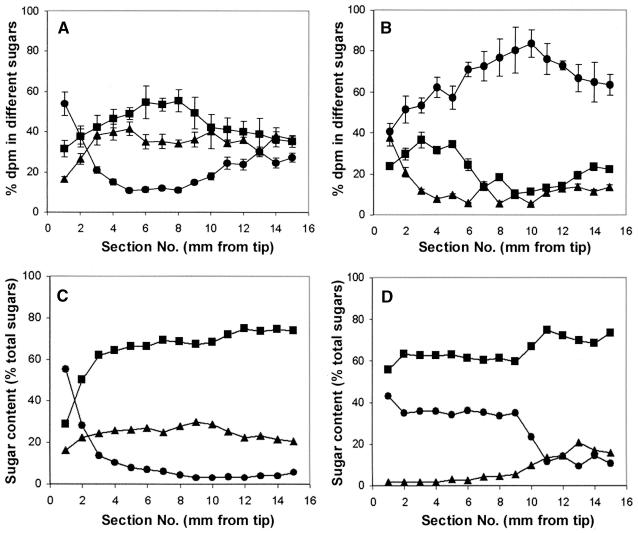
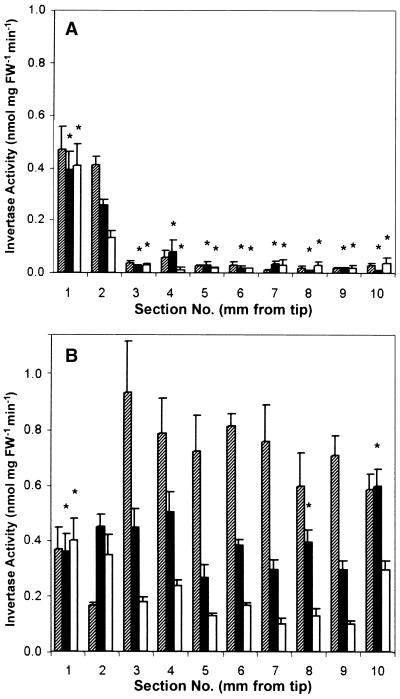
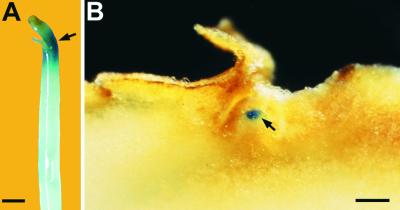
Phloem unloading was studied in potato plants in real time during the early stages of tuberization using carboxyfluorescein (CF) as a phloem-mobile tracer, and the unloading pattern was compared with autoradiography of tubers that had transported (14)C assimilates. In stolons undergoing extension growth, apoplastic phloem unloading predominated. However, during the first visible signs of tuberization, a transition occurred from apoplastic to symplastic transport, and both CF and (14)C assimilates subsequently followed identical patterns of phloem unloading. It is suggested that the switch to symplastic sucrose unloading may be responsible for the upregulation of several genes involved in sucrose metabolism. A detailed analysis of sugar levels and (14)C sugar partitioning in tuberizing stolons revealed a distinct difference between the apical region of the tuber and the subapical region. Analysis of invertase activity in nontuberizing and tuberizing stolons revealed a marked decline in soluble invertase in the subapical region of swelling stolons, consistent with the switch from apoplastic to symplastic unloading. However, cell wall-bound invertase activity remained high in the apical 1 to 2 mm of tuberizing stolons. Histochemical analysis of potato lines transformed with the promoter of an apoplastic invertase gene (invGE) linked to a reporter gene also revealed discrete gene expression in the apical bud region. Evidence is presented that the apical and lateral tuber buds function as isolated domains with respect to sucrose unloading and metabolism.


Figures

Figure 1.
Figure 1.
Stolon Tips of Potato (cv Desire) Showing Regions Taken for Analysis of Phloem Unloading and Sucrose Metabolism. (A) Note the prominent stolon hook, which marks a clear distinction between apical and subapical regions. Segments taken for analyses are indicated on the stolon. (B) Tuberizing stolon tips taken from a single plant. A number of distinct stages in the swelling process are apparent, ranging from no swelling (1) to prominent subapical swelling (4). Note the progressive incorporation of the apical bud into the growing tuber. Bars in (A) and (B) = 1 mm.
Figure 2.
Figure 2.
Confocal Laser Scanning Microscopy of CF Unloading in Comparison with 14C Autoradiography. (A) In nonswelling stolons, CF was restricted to the phloem (P) in both the stolon axis and hook regions. (B) In stolons of the same developmental stage, 14C was distributed evenly across the stolon axis and hook. (C) In stolons showing the first detectable subapical swelling, CF remained confined to the phloem strands. (D) At the same stage, 14C was unloaded uniformly across the subapical (bracketed) region of the tuberizing stolon. Note the decrease in labeling intensity of the apical region (acropetal to dotted line). (E) In visibly swollen stolons, CF showed distinct subapical unloading into parenchyma tissues. Note lack of dye movement into apical tissues (acropetal to dotted line). (F) Autoradiography of swelling stolon shows similar pattern to (E). The apical region (acropetal to dotted line) again shows less labeling than subapical tissues. (G) to (J) Visibly swollen tubers unloading CF and 14C, respectively. Unloading is apparent from both internal (IP) and external (EP) phloem networks. (K) Transverse section of growing tuber unloading CF. Extensive dye unloading is apparent from internal and external phloem networks. (L) Autoradiograph of tuber at a stage of development similar to that shown in (K). formula image. formula image. formula image. formula image to formula image and (L) formula image
Figure 3.
Figure 3.
CF Transport and Unloading in Stolons, Aborted Tubers, and Dormant Buds. (A) Transverse section of translocating stolon. CF is restricted to internal (IP) and external (EP) phloem systems. The functional xylem (X) was labeled with Texas Red dextran. (B) Tuberizing stolon showing separation of internal and external phloem strands by radial expansion. Note the unloading of dye from both networks. (C) Phloem unloading of CF from a sector of a large tuber. A diffuse gradient of CF is apparent from the phloem “poles.” The xylem ring was labeled with Texas Red dextran. (D) Sequential transverse sections from the same growing tuber. The stolon region is shown to the left and the tuber apex at the extreme right. Most of the CF unloading occurs from the subapical region of the tuber. (E) An aborted tuber shows import of CF (arrows) but no unloading into surrounding parenchyma tissues. (F) As shown in (E) with reduced labeling of the tuber relative to the phloem (P) of the stolon axis. (G) The dormant apical meristem (M) shows little or no CF import. In the region subtending the meristem (encircled), dye is apparent in the phloem but appears not to have unloaded (arrows). In comparison, dye unloading is extensive into parenchyma tissues outside this region. (H) A dormant lateral bud shows isolation similar to that described in (G). formula image (A) formula image; formula image (B) formula image (D) formula image; formula image (C) formula image (E) to (H) formula image.
Figure 4.
Figure 4.
Concentration of Radioactivity in 1-mm Sections Excised along the Axis of Plant Stolons. Stolons from nontuberizing plants (filled circles), small swelling stolons (2 to 5 mm diameter; filled triangles), or large swelling stolons (6 to 10 mm diameter; filled squares) are shown 4 hr after labeling of foliage with 14CO2. Values are given as average values ± sd of stolon populations of between eight and 10 individually labeled plants. All data points for small and large swelling stolons were significantly different (P > 0.01) from equivalent nonswelling stolon sections. FW, fresh weight.
Figure 5.
Figure 5.
Soluble Sugar Content in 1-mm Sections Excised along the Axis of Nonswelling Stolons, Small Swelling Stolons, or Large Swelling Stolons. (A) Sucrose. (B) Glucose. (C) Fructose. The symbols indicate nonswelling stolons (circles), small swelling stolons (triangles) and large swelling stolons (squares). The data points represent the average values ±sd of stolon populations sampled from six nontuberizing plants (nonswelling stolons) or five tuberizing plants (swelling stolons). Data points for small or large swelling stolons that were significantly different (P > 0.01) from equivalent sections of nonswelling stolons are shown as closed symbols, and those that were not significantly different are shown as open symbols. FW, fresh weight.
Figure 6.
Figure 6.
Relative Distribution of Radioactivity within the Soluble Sugars Pool along the Axis of Nonswelling Stolons or Large Swelling Stolons Taken from Nontuberizing and Tuberizing Plants, Respectively, 4 h after Labeling of the Foliage with 14CO2. (A) and (C) Nonswelling stolons. (B) and (D) Large swelling stolons. The symbols used indicate sucrose (circles), glucose (squares) and fructose (triangles). The data are presented as radioactivity recovered in each sugar as a percentage of the total radioactivity recovered in the soluble sugars pool (sucrose + fructose + glucose). For comparative analyses, the relative sugar distributions in each section for nonswelling stolons and swelling stolons are shown in (C) and (D), respectively (data recalculated from Figure 4). Data for (A) and (B) are average values ±sd of eight to 10 stolons from two nontuberizing and three tuberizing plants.
Figure 7.
Figure 7.
Distribution of Cell Wall–Bound and Soluble Acid Invertase Activity. (A) Cell-wall bound invertase activity. (B) Soluble invertase activity. Activity was determined along the axis of nonswelling stolons (striped grey bars), small swelling stolons (black bars), and large swelling stolons (white bars). Data are shown as average values ±sd (n = 4). Asterisks indicate data points that were not significantly (P > 0.01) different to equivalent sections of nonswelling stolons. FW, fresh weight.
Figure 8.
Figure 8.
Expression of an Apoplastic Invertase (invGE) Revealed by GUS Staining. (A) GUS staining is restricted to the apical hook region of an elongating stolon (arrow). (B) Developing tuber showing GUS staining associated with the apical bud region (arrow). Bar in (A) = 1 mm; bar in (B) = 500 μm.

References

    1. Appeldoorn, N.J.G., de Bruijn, S.M., Koot-Gronsveld, E.A.M., Visser, R.G.F., Vreugdenhil, D., and van der Plas, L. (1997). Developmental changes involved in conversion of sucrose to hexose-phosphate during early tuberization of potato. Planta 202, 220–226.
    1. Artschwager, E.F. (1924). Studies on the potato tuber. J. Agric. Res. 24, 809–835.
    1. Catchpole, A.H., and Hillman, J. (1969). Effect of ethylene on tuber initiation in Solanum tuberosum L. Nature 223, 1387.
    1. Cutter, E.G. (1978). Structure and development of the potato plant. In The Growth of the Potato, J.D. Ivins and F.L. Milthorpe, eds (London: Butterworth), pp. 99–113.
    1. Davies, H.V. (1984). Sugar metabolism in stolon tips during early tuberization. Z. Pflanzenphysiol. 113, 377–381.

Publication types

MeSH terms

LinkOut - more resources