. 2001 Feb 27;98(5):2199-204.
doi: 10.1073/pnas.041605498.

Delineating developmental and metabolic pathways in vivo by expression profiling using the RIKEN set of 18,816 full-length enriched mouse cDNA arrays

Affiliations

Delineating developmental and metabolic pathways in vivo by expression profiling using the RIKEN set of 18,816 full-length enriched mouse cDNA arrays

R Miki et al. Proc Natl Acad Sci U S A. .

Abstract

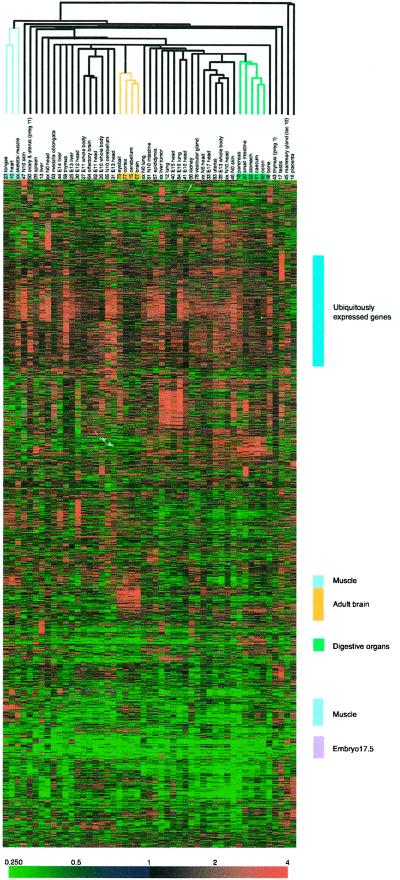
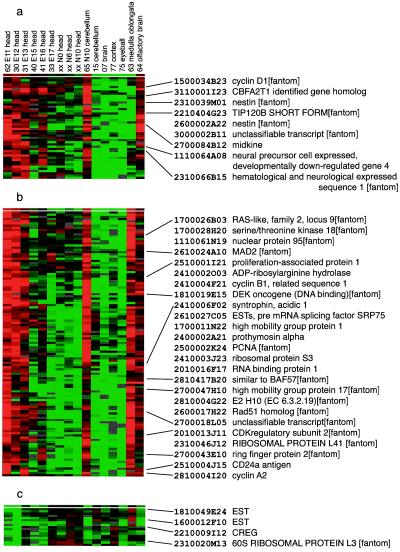
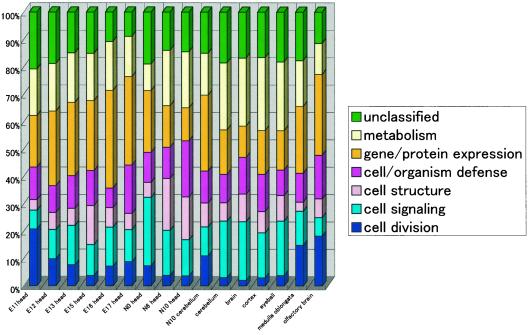
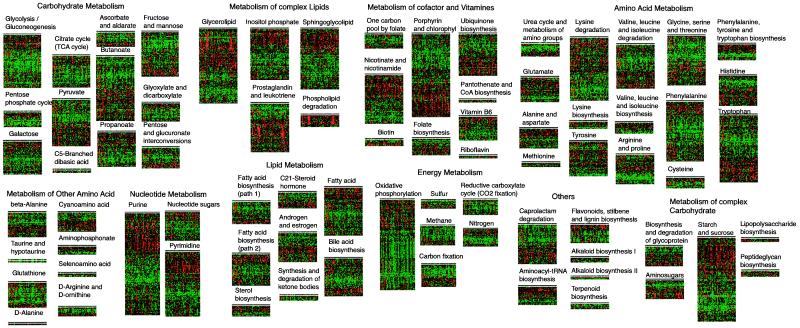
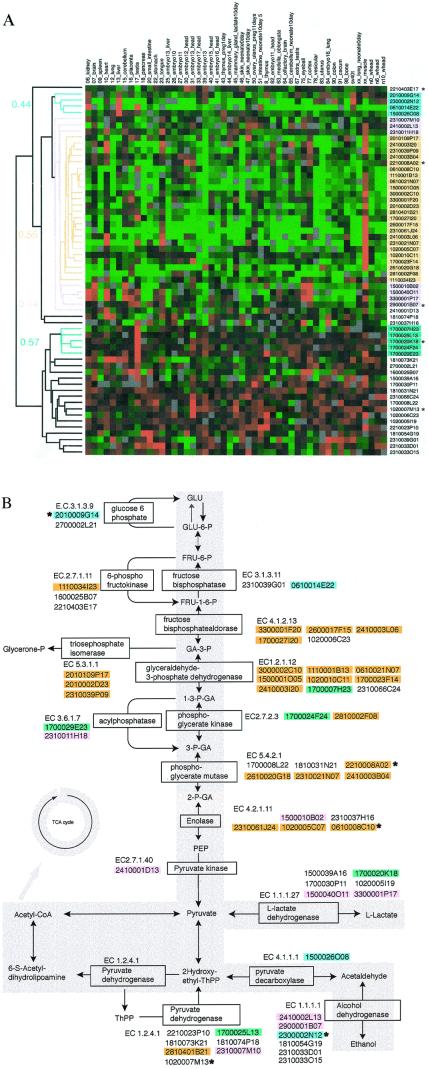
We have systematically characterized gene expression patterns in 49 adult and embryonic mouse tissues by using cDNA microarrays with 18,816 mouse cDNAs. Cluster analysis defined sets of genes that were expressed ubiquitously or in similar groups of tissues such as digestive organs and muscle. Clustering of expression profiles was observed in embryonic brain, postnatal cerebellum, and adult olfactory bulb, reflecting similarities in neurogenesis and remodeling. Finally, clustering genes coding for known enzymes into 78 metabolic pathways revealed a surprising coordination of expression within each pathway among different tissues. On the other hand, a more detailed examination of glycolysis revealed tissue-specific differences in profiles of key regulatory enzymes. Thus, by surveying global gene expression by using microarrays with a large number of elements, we provide insights into the commonality and diversity of pathways responsible for the development and maintenance of the mammalian body plan.


Figures

Figure 1
Figure 1
Hierarchical clustering of gene expression data. Depicted are the approximately 1.8 million measurements of gene expression from the 294 microarray analyses of 49 adult and embryonic tissues. The dendrogram lists the tissues studied and provides a measure of the relatedness of gene expression in each sample. Each row represents a single cDNA clone on the microarray, whereas each column corresponds to a separate mRNA sample. The results presented represent the ratio of hybridization of fluorescent cDNA probes prepared from each tissue mRNA samples to a reference mRNA sample (derived from entire E17.5 mouse embryos). These ratios are a measure of relative gene expression in each experimental sample and are depicted according to the color scale shown at the bottom. As indicated, the scale extends from fluorescence ratios of 0.25 to 4 (−2 to +2 in log base 2 units). Gray indicates missing or excluded data. FANTOM, Functional Annotation of Mouse cDNAs.
Figure 2
Figure 2
Hierarchical clustering of tissue expression profile of developmental stage of CNS. (a, b, and c) Expanded views of biologically distinct gene expression signatures in the CNS set. Genes inversely correlated with cyclin D1 were extracted and shown in c. All of the gene names included in these clusters are provided in Fig. 8 a, b, and c, respectively, which is published as supplemental data on the PNAS web site, www.pnas.org.
Figure 3
Figure 3
Ratios of cellular roles for each CNS tissue. Cellular roles were assigned to the 2,206 genes in light of results from searching the TIGR EGAD database (http://www.tigr.org/tdb/egad/egad.shtml). Ratios of cellular roles for all of the 49 tissues are also available in supplementary data at (http://genome.gsc.riken.go.jp/READ/supplementary/).
Figure 4
Figure 4
Hierarchical tree view of the clustered genes of all metabolic pathways. Clones that meet the criteria as described in Materials and Methods were clustered for genes and shown. All of the genes included in each pathway are shown as supplementary information at (http://genome.gsc.riken.go.jp/READ/supplementary/allpathway/).
Figure 5
Figure 5
(a) Hierarchical tree view of the clustered genes that are involved in the glycolysis pathway. The colors correspond to those of b. Gene names are provided in Fig. 9, which is published as supplementary data on the PNAS web site, www.pnas.org. (b) Glycolysis pathway map derived from the RIKEN 19K set. Genes that have high correlation with each other are colored. Genes colored in yellow, blue, and green show the correlation coefficient value of 0.64, 0.52 and 0.54, respectively. The genes shown in pink were categorized in the same group as the genes shown in yellow but with a correlation coefficient value of 0.42. A * indicates the annotations of these genes were inherited from the FANTOM annotation.

References

    1. DeRisi J L, Iyer V R, Brown P O. Science. 1997;278:680–686. - PubMed
    1. Behr M A, Wilson M A, Gill W P, Salamon H, Schoolnik G K, Rane S, Small P M. Science. 1999;284:1520–1523. - PubMed
    1. White K P, Rifkin S A, Hurban P, Hogness D S. Science. 1999;286:2179–2184. - PubMed
    1. Tanaka T S, Jaradat S A, Lim M K, Kargul G J, Wang X, Grahovac M J, Pantano S, Sano Y, Piao Y, Nagaraja R, et al. Proc Natl Acad Sci USA. 2000;97:9127–9132. - PMC - PubMed
    1. Carninci P, Hayashizaki Y. Methods Enzymol. 1999;303:19–44. - PubMed

Publication types

LinkOut - more resources