. 2001 Feb 27;98(5):2399-406.
doi: 10.1073/pnas.051631998.

Organellar relationships in the Golgi region of the pancreatic beta cell line, HIT-T15, visualized by high resolution electron tomography

Affiliations

Organellar relationships in the Golgi region of the pancreatic beta cell line, HIT-T15, visualized by high resolution electron tomography

B J Marsh et al. Proc Natl Acad Sci U S A. .

Abstract

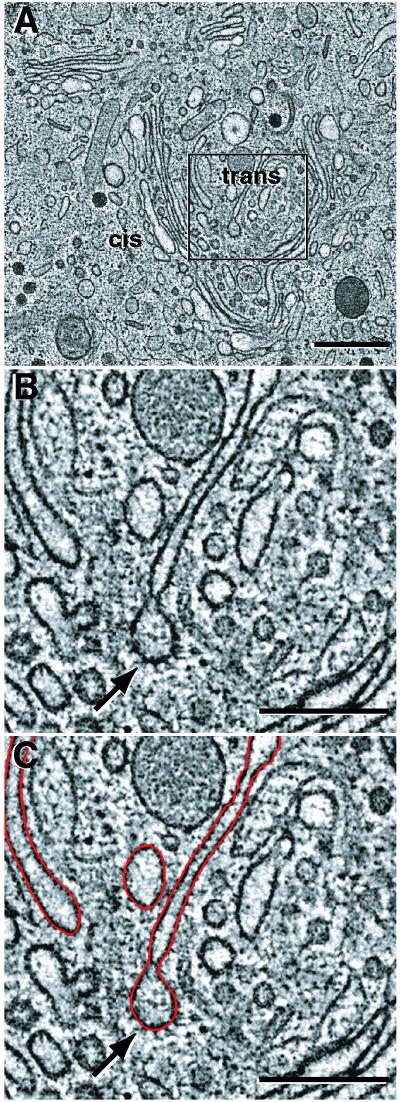
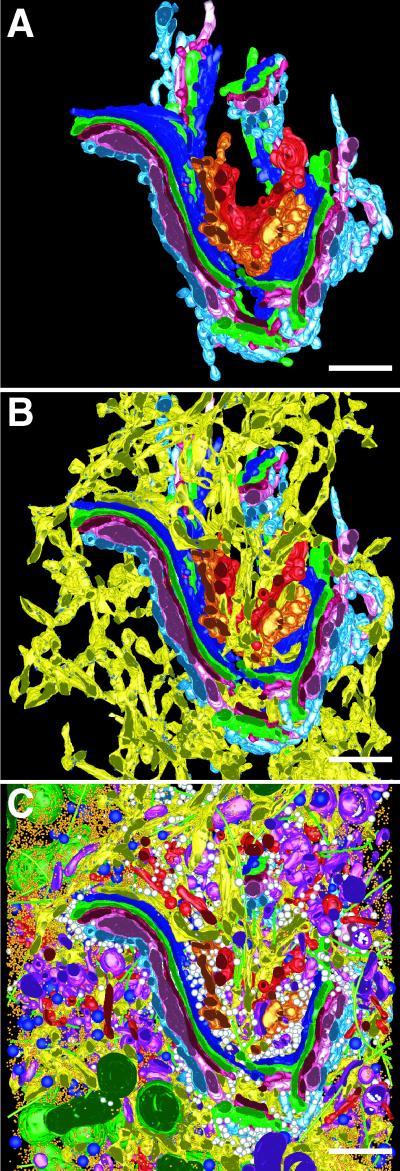
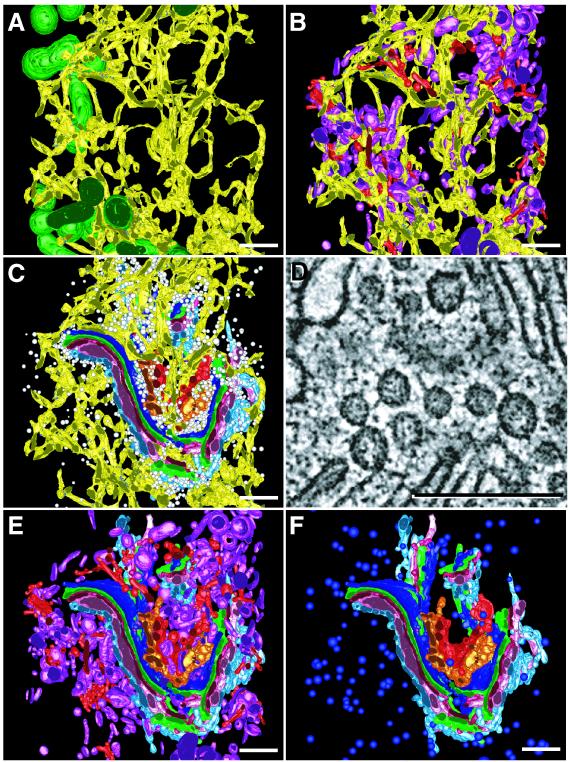
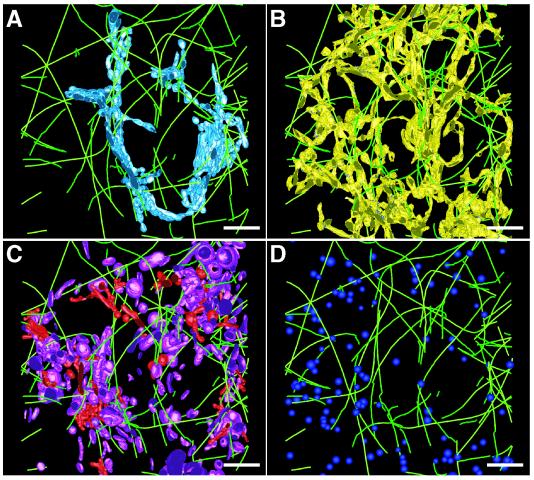
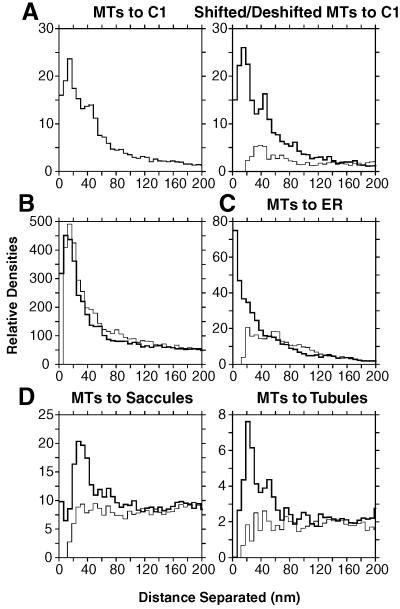
The positional relationships among all of the visible organelles in a densely packed region of cytoplasm from an insulin secreting, cultured mammalian cell have been analyzed in three dimensions (3-D) at approximately 6 nm resolution. Part of a fast frozen/freeze-substituted HIT-T15 cell that included a large portion of the Golgi ribbon was reconstructed in 3-D by electron tomography. The reconstructed volume (3.1 x 3.2 x 1.2 microm(3)) allowed sites of interaction between organelles, and between microtubules and organellar membranes, to be accurately defined in 3-D and quantitatively analyzed by spatial density analyses. Our data confirm that the Golgi in an interphase mammalian cell is a single, ribbon-like organelle composed of stacks of flattened cisternae punctuated by openings of various sizes [Rambourg, A., Clermont, Y., & Hermo, L. (1979) Am. J. Anat. 154, 455-476]. The data also show that the endoplasmic reticulum (ER) is a single continuous compartment that forms close contacts with mitochondria, multiple trans Golgi cisternae, and compartments of the endo-lysosomal system. This ER traverses the Golgi ribbon from one side to the other via cisternal openings. Microtubules form close, non-random associations with the cis Golgi, the ER, and endo-lysosomal compartments. Despite the dense packing of organelles in this Golgi region, approximately 66% of the reconstructed volume is calculated to represent cytoplasmic matrix. We relate the intimacy of structural associations between organelles in the Golgi region, as quantified by spatial density analyses, to biochemical mechanisms for membrane trafficking and organellar communication in mammalian cells.


Figures

Figure 1
Figure 1
3-D reconstruction of part of the Golgi ribbon. (A) A 3.8-nm tomographic slice (slice 169) extracted from the 315 slices that together comprise the reconstructed volume. The area shown (3.1 × 3.2 μm2) was modeled and analyzed in detail. Bar = 500 nm. The boxed area in A is shown at higher magnification in B and C. (B and C) Membranes were modeled by placing points along the bilayers, connecting the points with colored line segments, and building closed contours that delimited distinct membrane-bounded compartments and vesicles for each of the 315 tomographic slices. Arrow, clathrin-coated budding profile; cis and trans refer to the entry and exit faces of the Golgi ribbon. Bars = 250 nm.
Figure 2
Figure 2
3-D model of the Golgi region. By using the software imod, each modeled object could be extracted and viewed in any given orientation and in context with any other object(s) to analyze complex morphologies with minimal ambiguity. (A) The seven cisternae that comprise the Golgi in the region modeled. C1, light blue; C2, pink; C3, cherry red; C4, green; C5, dark blue; C6, gold; C7, bright red. (B) The ER (yellow) traverses the Golgi stack at multiple points and extends in opposite directions beyond the cis-most and trans-most cisternae. (C) The Golgi displayed in the context of all organelles, vesicles, ribosomes, and MTs visible by EM in the modeled region. ER, yellow; membrane-bound ribosomes, blue; free ribosomes, orange; MTs, bright green; dense core vesicles, bright blue; clathrin-negative vesicles, white; clathrin-positive compartments and vesicles, bright red; clathrin-negative compartments and vesicles, purple; mitochondria, dark green. Bars = 500 nm.
Figure 3
Figure 3
Structural evidence for physical relationships among different organelles in the modeled region. The ER is closely apposed to mitochondria (dark green) (A), clathrin-positive (red) and clathrin-negative (purple) endo-lysosomal compartments (B). (C) Here, 2,119 small (average diameter 52 nm), spherical, non-clathrin vesicles (white) were distributed close to the Golgi and ER. (D) Higher magnification image extracted from tomographic data showing the numerous tethers connecting small vesicles to each other and to Golgi membranes. Bar = 250 nm. (E) Subsets of endo-lysosomal compartments with distinct morphological profiles were clustered together in the Golgi region. (F) Here, 132 dense core vesicles (bright blue; average diameter 100 nm) were present in the Golgi region but were apart from the Golgi stack. Bars = 500 nm.
Figure 4
Figure 4
The MT cytoskeleton associates with membranes of the Golgi, ER, and endo-lysosomal compartments. The paths of MTs (bright green) closely followed and occasionally formed contacts with the membranes of C1 (light blue; A) and the ER (yellow; B). Clathrin-positive (red) and clathrin-negative (purple) compartments (C) and dense core vesicles (bright blue; D) in the reconstructed volume were modeled so that in situ spatial relationships between these elements and MTs could be reliably quantified and assessed. Bars = 500 nm.
Figure 5
Figure 5
Analysis of distances between modeled objects in the reconstructed volume. To determine the significance of peaks in density analysis graphs, the real distributions of objects were compared with randomized distributions of the same objects. Peaks in the real spatial distributions (bold lines) that are substantially above the randomized distributions (thin lines) are likely to represent specific associations. (A Left) Histogram showing the real distribution of distances from 10-nm subsegments of MTs to C1. (Right) Because only 72% of the MTs could be shifted randomly in 3-D without colliding with other objects, the density distribution of only those MTs that could be shifted and thereby randomized for the analysis (“shifted”) is compared with their distribution after being returned to their original positions (“deshifted”). (B) The density of clathrin-negative endo-lysosomal compartments around non-clathrin vesicles provides an example of a null relationship. The peak in the real distribution is indistinguishable from that observed in randomized distributions of non-clathrin vesicles, suggesting that there is no specific relationship between them. Spatial density analysis revealed strong evidence for specific associations between MTs and the ER (C), and between MTs and some morphological subsets of elements broadly classified as endo-lysosomal compartments (D), respectively.

References

    1. Lindsey J D, Ellisman M H. J Neurosci. 1985;5:3124–3134. - PMC - PubMed
    1. Tanaka K, Fukudome H. J Electron Microsc Technol. 1991;17:15–23. - PubMed
    1. Weidman P, Roth R, Heuser J. Cell. 1993;75:123–133. - PubMed
    1. Ladinsky M S, Kremer J R, Furcinitti P S, McIntosh J R, Howell K E. J Cell Biol. 1994;127:29–38. - PMC - PubMed
    1. Rambourg A, Clermont Y. In: The Golgi Apparatus. Berger E G, Roth J, editors. Basel: Birkhauser; 1997. pp. pp.37–61.

Publication types

LinkOut - more resources