

High-sensitivity array analysis of gene expression for the early detection of disseminated breast tumor cells in peripheral blood
- PMID: 11226293
- PMCID: PMC30192
- DOI: 10.1073/pnas.041622398
High-sensitivity array analysis of gene expression for the early detection of disseminated breast tumor cells in peripheral blood
Abstract
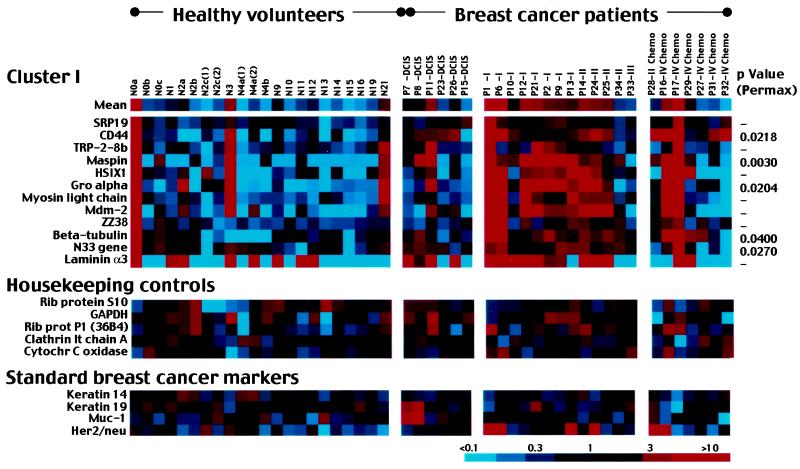
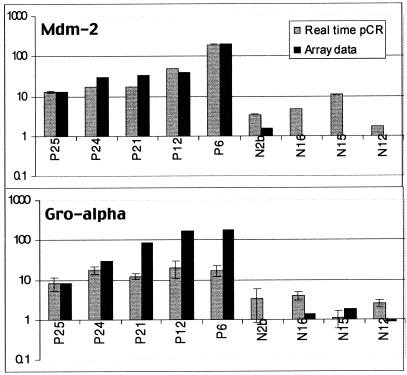
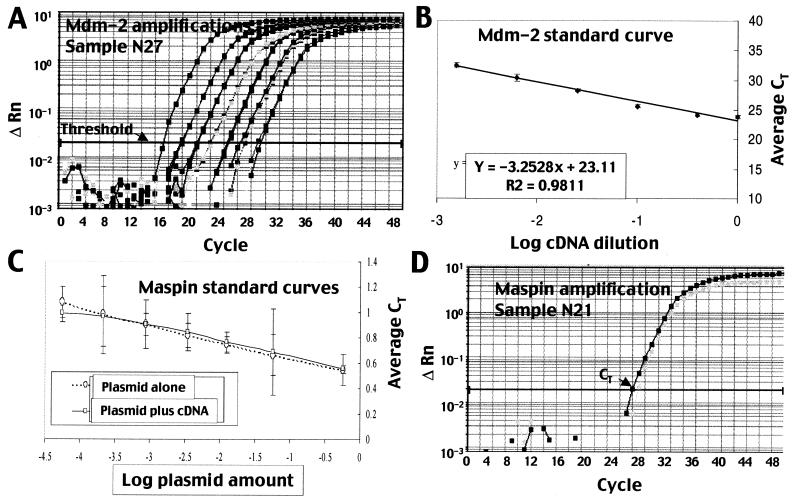
Early detection is an effective means of reducing cancer mortality. Here, we describe a highly sensitive high-throughput screen that can identify panels of markers for the early detection of solid tumor cells disseminated in peripheral blood. The method is a two-step combination of differential display and high-sensitivity cDNA arrays. In a primary screen, differential display identified 170 candidate marker genes differentially expressed between breast tumor cells and normal breast epithelial cells. In a secondary screen, high-sensitivity arrays assessed expression levels of these genes in 48 blood samples, 22 from healthy volunteers and 26 from breast cancer patients. Cluster analysis identified a group of 12 genes that were elevated in the blood of cancer patients. Permutation analysis of individual genes defined five core genes (P < or = 0.05, permax test). As a group, the 12 genes generally distinguished accurately between healthy volunteers and patients with breast cancer. Mean expression levels of the 12 genes were elevated in 77% (10 of 13) untreated invasive cancer patients, whereas cluster analysis correctly classified volunteers and patients (P = 0.0022, Fisher's exact test). Quantitative real-time PCR confirmed array results and indicated that the sensitivity of the assay (1:2 x 10(8) transcripts) was sufficient to detect disseminated solid tumor cells in blood. Expression-based blood assays developed with the screening approach described here have the potential to detect and classify solid tumor cells originating from virtually any primary site in the body.
Figures
References
-
- Harris R. J Natl Cancer Inst Monogr. 1997;22:139–143. - PubMed
-
- Bolen J C, Rhodes L, Powell-Griner E E, Bland S D, Holtzman D. Morbid Mortal Wkly Rep. 2000;49:1–60. - PubMed
-
- de Cremoux P, Extra J M, Denis M G, Pierga J Y, Bourstyn E, Nos C, Clough K B, Boudou E, Martin E C, Muller A, et al. Clin Cancer Res. 2000;6:3117–3122. - PubMed
-
- Kraeft S K, Sutherland R, Gravelin L, Hu G H, Ferland L H, Richardson P, Elias A, Chen L B. Clin Cancer Res. 2000;6:434–442. - PubMed
Publication types
MeSH terms
Substances
Grants and funding
LinkOut - more resources
Full Text Sources
Other Literature Sources
Medical
Research Materials
