. 2001 Feb 27;98(5):2776-80.
doi: 10.1073/pnas.041600898.

Coinciding early activation of the human primary visual cortex and anteromedial cuneus

Affiliations

Coinciding early activation of the human primary visual cortex and anteromedial cuneus

S Vanni et al. Proc Natl Acad Sci U S A. .

Abstract

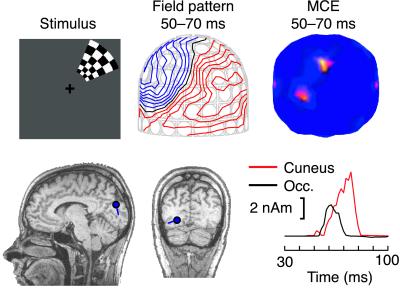
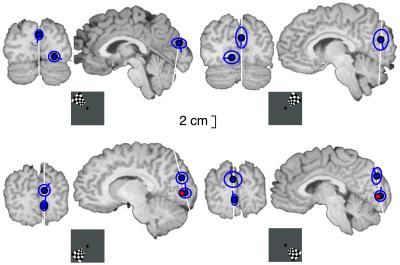
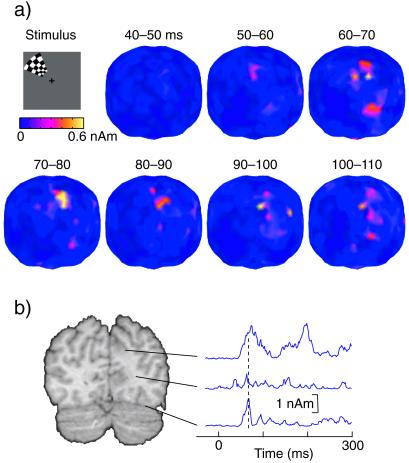
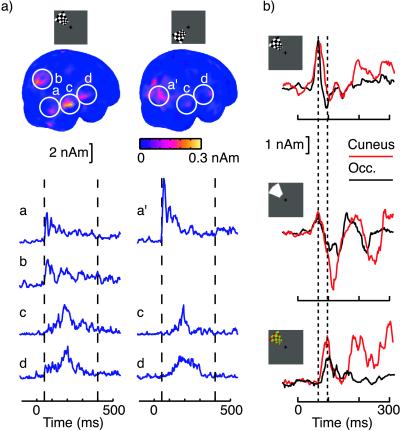
Proper understanding of processes underlying visual perception requires information on the activation order of distinct brain areas. We measured dynamics of cortical signals with magnetoencephalography while human subjects viewed stimuli at four visual quadrants. The signals were analyzed with minimum current estimates at the individual and group level. Activation emerged 55-70 ms after stimulus onset both in the primary posterior visual areas and in the anteromedial part of the cuneus. Other cortical areas were active after this initial dual activation. Comparison of data between species suggests that the anteromedial cuneus either comprises a homologue of the monkey area V6 or is an area unique to humans. Our results show that visual stimuli activate two cortical areas right from the beginning of the cortical response. The anteromedial cuneus has the temporal position needed to interact with the primary visual cortex V1 and thereby to modify information transferred via V1 to extrastriate cortices.


Figures

Figure 1
Figure 1
Data of Subject 1 after right upper quadrant BW pattern reversal. Magnetic field pattern and the corresponding MCE results, viewed from the back of the head, are integrated from 50 to 70 ms. The red contours in the magnetic field display indicate the magnetic flux coming out from the head and the blue contours the magnetic flux entering the head. The blue dots and lines on the individual MRIs represent the center and orientation of the estimated current. The red and black curves show the strengths of the anteromedial cuneus and left occipital (Occ.) sources as a function of time.
Figure 2
Figure 2
The mean location, its SD, and current orientation (blue dot, circle, and line, respectively) of the cuneus and inferior occipital sources are displayed in a standard brain (18). The red dot displays the mean location of left and right V1 from Hasnain et al. (13), who reported, however, the average location of the upper and lower visual field representations.
Figure 3
Figure 3
(a) Group average MCEs after left upper quadrant pattern reversals, integrated over successive 10-ms intervals after stimulus. (b) Spherical smooth-edged regions of interests with 8-mm radius are placed close the higher and lower current clusters and between. The ROIs are presented on the standard brain MRI (18). The right column shows the signal strength of these ROIs as a function of time.
Figure 4
Figure 4
(a) Group average MCE after left upper and left lower quadrant pattern reversals, integrated from 50 to 400 ms after stimulus. Note that averaging the signal from 50 to 400 ms makes the earliest transient activation poorly visible. The four distinct ROIs are in the posterior inferior occipital cortex (a and a′), in the anteromedial cuneus (b), in the temporooccipital junction (c), and in the superior temporal sulcus (d). After left lower quadrant stimuli, the group average MCE separate poorly the cuneus and occipital sources because the two areas are close together and there is some interindividual variance in locations—the two distinct sources were better separable in individual data. (b) Group average amplitude as a function of time for BW pattern reversal, luminance onset, and equiluminant RG pattern reversal stimuli at the left upper quadrant. The dashed vertical lines indicate latencies at 67 and 97 ms. The amplitude curves reflect group average activity at the mean locations of the individual sources, determined from BW data.

References

    1. Felleman D J, Van Essen D C. Cereb Cortex. 1991;1:1–47. - PubMed
    1. Schmolesky M T, Wang Y, Hanes D, Thompson K G, Leutgeb S, Schall J D, Leventhal A G. J Neurophysiol. 1998;79:3272–3278. - PubMed
    1. Schroeder C E, Mehta A D, Givre S J. Cereb Cortex. 1998;8:575–592. - PubMed
    1. Orban A G. In: Cerebral Cortex. Rockland K S, Kaas J H, Peters A, editors. Vol. 12. London: Plenum; 1997. pp. 359–434.
    1. Schall J D. In: Cerebral Cortex. Rockland K S, Kaas J H, Peters A, editors. Vol. 12. London: Plenum; 1997. pp. 527–638.

Publication types

LinkOut - more resources