

An orchestrated gene expression component of neuronal programmed cell death revealed by cDNA array analysis
- PMID: 11226323
- PMCID: PMC30222
- DOI: 10.1073/pnas.051630598
An orchestrated gene expression component of neuronal programmed cell death revealed by cDNA array analysis
Abstract
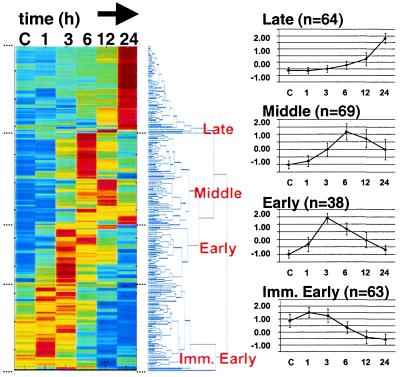
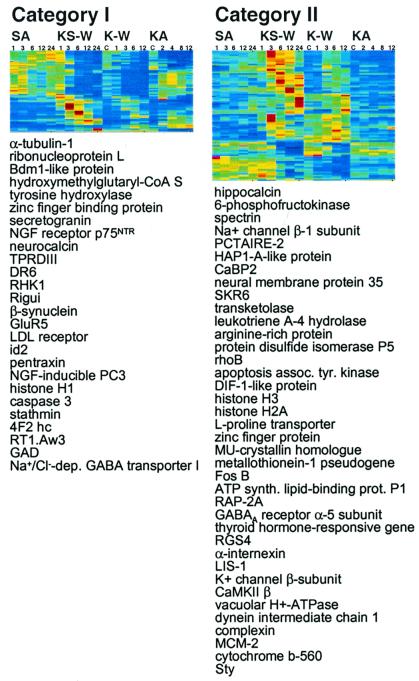
Programmed cell death (PCD) during neuronal development and disease has been shown to require de novo RNA synthesis. However, the time course and regulation of target genes is poorly understood. By using a brain-biased array of over 7,500 cDNAs, we profiled this gene expression component of PCD in cerebellar granule neurons challenged separately by potassium withdrawal, combined potassium and serum withdrawal, and kainic acid administration. We found that hundreds of genes were significantly regulated in discreet waves including known genes whose protein products are involved in PCD. A restricted set of genes was regulated by all models, providing evidence that signals inducing PCD can regulate large assemblages of genes (of which a restricted subset may be shared in multiple pathways).
Figures
Similar articles
-
Genes regulated in neurons undergoing transcription-dependent apoptosis belong to signaling pathways rather than the apoptotic machinery.J Biol Chem. 2005 Feb 18;280(7):5693-702. doi: 10.1074/jbc.M408971200. Epub 2004 Nov 12. J Biol Chem. 2005. PMID: 15542599
-
Gene expression profiles of apoptotic neurons.Genomics. 2004 Sep;84(3):485-96. doi: 10.1016/j.ygeno.2004.04.006. Genomics. 2004. PMID: 15498456
-
Comparative microarray analysis of programmed cell death induced by proteasome malfunction and hypersensitive response in plants.Biochem Biophys Res Commun. 2006 Apr 7;342(2):514-21. doi: 10.1016/j.bbrc.2006.01.176. Epub 2006 Feb 9. Biochem Biophys Res Commun. 2006. PMID: 16487931
-
Cerebellar granule cells as a model to study mechanisms of neuronal apoptosis or survival in vivo and in vitro.Cerebellum. 2002 Jan-Mar;1(1):41-55. doi: 10.1080/147342202753203087. Cerebellum. 2002. PMID: 12879973 Review.
-
Programmed cell death in cerebral ischemia.J Cereb Blood Flow Metab. 2001 Feb;21(2):99-109. doi: 10.1097/00004647-200102000-00001. J Cereb Blood Flow Metab. 2001. PMID: 11176275 Review.
Cited by
-
Proprotein convertase subtilisin/kexin type 9 deficiency reduces melanoma metastasis in liver.Neoplasia. 2012 Dec;14(12):1122-31. doi: 10.1593/neo.121252. Neoplasia. 2012. PMID: 23308045 Free PMC article.
-
Cracking the Code of Neuronal Cell Fate.Cells. 2023 Mar 30;12(7):1057. doi: 10.3390/cells12071057. Cells. 2023. PMID: 37048129 Free PMC article. Review.
-
Coming Back to Physiology: Extra Hepatic Functions of Proprotein Convertase Subtilisin/Kexin Type 9.Front Physiol. 2020 Dec 7;11:598649. doi: 10.3389/fphys.2020.598649. eCollection 2020. Front Physiol. 2020. PMID: 33364976 Free PMC article. Review.
-
Altered histone acetylation at glutamate receptor 2 and brain-derived neurotrophic factor genes is an early event triggered by status epilepticus.J Neurosci. 2002 Oct 1;22(19):8422-8. doi: 10.1523/JNEUROSCI.22-19-08422.2002. J Neurosci. 2002. PMID: 12351716 Free PMC article.
-
Pleiotropy of PCSK9: Functions in Extrahepatic Tissues.Curr Cardiol Rep. 2023 Sep;25(9):979-985. doi: 10.1007/s11886-023-01918-2. Epub 2023 Jul 10. Curr Cardiol Rep. 2023. PMID: 37428313 Review.
References
-
- Pettmann B, Henderson C E. Neuron. 1998;20:633–747. - PubMed
-
- Hetts S W. J Am Med Assoc. 1998;279:300–307. - PubMed
-
- Raff M C, Barres B A, Burne J F, Coles H S, Ishizaki Y, Jacobson M D. Science. 1993;262:695–700. - PubMed
-
- Dragunow M, Preston K. Brain Res Rev. 1995;21:1–28. - PubMed
-
- Kaufman R J. Genes Dev. 1999;13:1211–1233. - PubMed
MeSH terms
Substances
LinkOut - more resources
Full Text Sources
Other Literature Sources
