. 2001 Feb 27;98(5):2934-9.
doi: 10.1073/pnas.041431898. Epub 2001 Feb 20.

Lifespan depends on month of birth

Affiliations

Lifespan depends on month of birth

G Doblhammer et al. Proc Natl Acad Sci U S A. .

Abstract

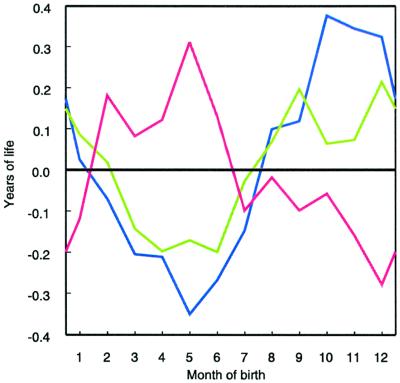
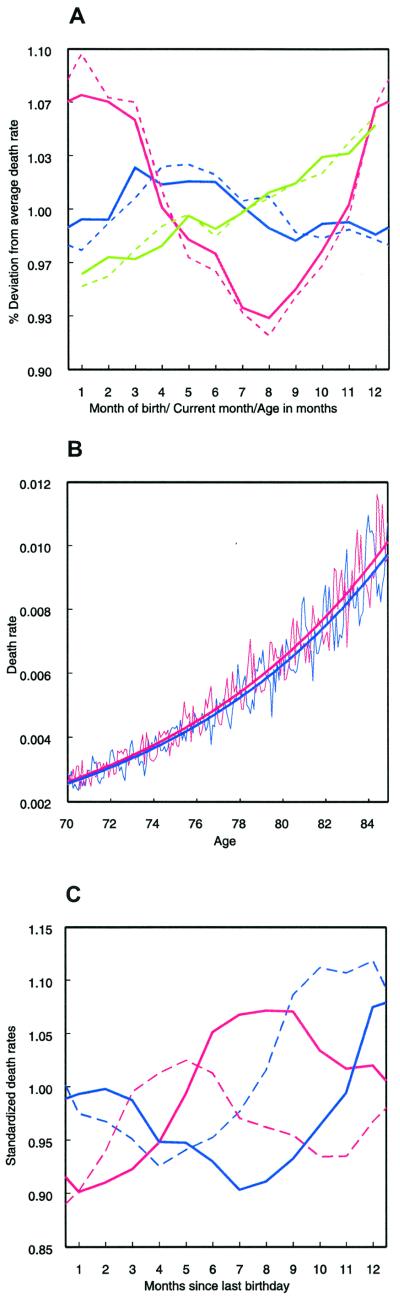
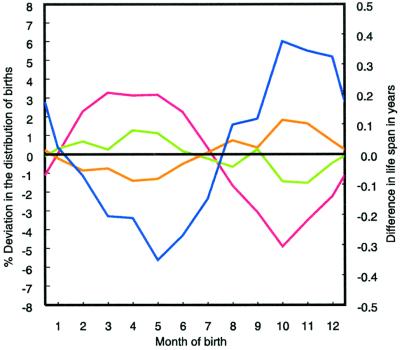
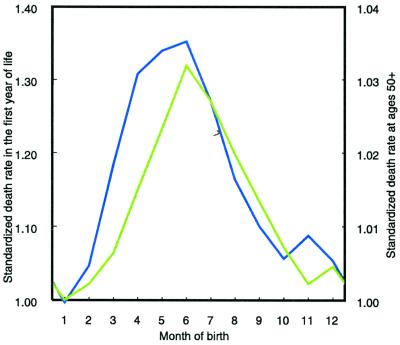
Month of birth influences adult life expectancy at ages 50+. Why? In two countries of the Northern Hemisphere-Austria and Denmark-people born in autumn (October-December) live longer than those born in spring (April-June). Data for Australia show that, in the Southern Hemisphere, the pattern is shifted by half a year. The lifespan pattern of British immigrants to Australia is similar to that of Austrians and Danes and significantly different from that of Australians. These findings are based on population data with more than a million observations and little or no selectivity. The differences in lifespan are independent of the seasonal distribution of deaths and the social differences in the seasonal distribution of births. In the Northern Hemisphere, the excess mortality in the first year of life of infants born in spring does not support the explanation of selective infant survival. Instead, remaining life expectancy at age 50 appears to depend on factors that arise in utero or early in infancy and that increase susceptibility to diseases later in life. This result is consistent with the finding that, at the turn of the last century, infants born in autumn had higher birth weights than those born in other seasons. Furthermore, differences in adult lifespan by month of birth decrease over time and are significantly smaller in more recent cohorts, which benefited from substantial improvements in maternal and infant health.


Figures

Figure 1
Figure 1
Deviation in remaining lifespan of people born in specific months from the average remaining lifespan at age 50. In the Northern Hemisphere countries of Denmark (green line) and Austria (blue line), the people born in the fourth quarter of the year live longer than those born in the second quarter. For Australia (red line), the pattern is shifted by half a year.
Figure 2
Figure 2
Cohort effects (i.e., month of birth), period effects (i.e., current month), and age effects for the Danish data. (A) Deviation of the monthly from the annual death rates by age in months (green line), month of death (red line), month of birth (blue line), and sex (solid lines for females and dashed lines for males). (B) Monthly death rates and average mortality trajectories between the ages of 70 and 85 for June- and December-born. According to the different seasons of the year, the monthly death rates (solid lines) cyclically fluctuate around the exponentially increasing mortality trajectories (bold solid lines), which are fitted exponential functions. The mortality trajectory of the June-born (bold red line) is higher than that of the December-born (bold blue line). (C) Monthly deviations from the annual death rate as a result of the simultaneous effects of season of death, monthly increases in mortality, and month of birth for females (for males see supplemental Fig. 5). The monthly deviations are derived from the parameter values of two separate multivariate regression models for males and females. The mortality in the month after their last birthday of those born in January is taken as the reference mortality (relative deviation = 1). A Dane born in December (blue bold line) experiences low age-specific mortality and high seasonal mortality during the first 4 months after the last birthday. Although age-specific mortality increases continuously, the seasonal mortality risk decreases faster until it reaches its minimum in August. Thus, someone born in December experiences the lowest mortality 9 months after the last birthday. The reverse is true for a Dane born in June (red bold line). The trajectories of those born in March (blue dashed line) and September (red dashed line) are similar but shifted.
Figure 3
Figure 3
Percentage deviations in the seasonal distribution of births of Austrians (ages 50+ in 1991) by education from the average seasonal distribution of births. Austrians with medium (green line) or high (red line) education are predominantly born in spring, those with basic education (orange line) in autumn. Observed differences in mean age at death are shown by the blue line.
Figure 4
Figure 4
Standardized death rates of Danish infants born in a specific month (green line) compared with standardized death rates at ages 50+ by month of birth (blue line). The standardized death rates are estimated by applying Eqs. 3 and 4. The mortality of those born in January is taken as the reference mortality (relative deviation = 1).

Similar articles

Cited by

References

    1. Vaupel J W, Carey J R, Christensen K, Johnson T E, Yashin A I, Holm N V, Iachine I A, Kannisto V, Khazaeli A A, Liedo P, et al. Science. 1998;280:855–860. - PubMed
    1. Christensen K, Vaupel J W. J Intern Med. 1996;240:333–341. - PubMed
    1. Fogel R W, Costa D R. Demography. 1997;34:49–66. - PubMed
    1. Barker D J P. Mothers, Babies and Diseases in Later Life. London: BMJ Publishing Group; 1994.
    1. Barker D J P. Br Med J. 1995;311:171–174. - PubMed

LinkOut - more resources