Comparative Study
. 2000 Nov-Dec;2(6):491-5.
doi: 10.1038/sj.neo.7900121.

Rapid and quantitative assessment of cancer treatment response using in vivo bioluminescence imaging

Affiliations
Comparative Study

Rapid and quantitative assessment of cancer treatment response using in vivo bioluminescence imaging

A Rehemtulla et al. Neoplasia. 2000 Nov-Dec.

Abstract

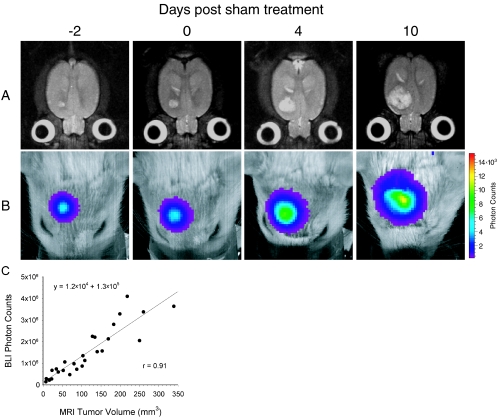
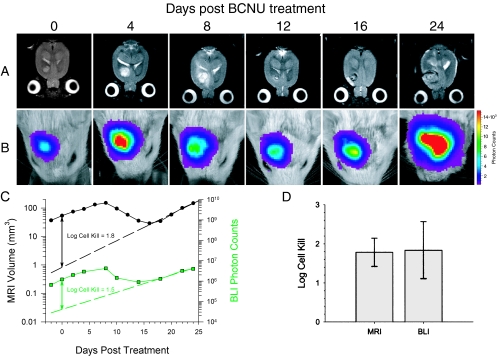
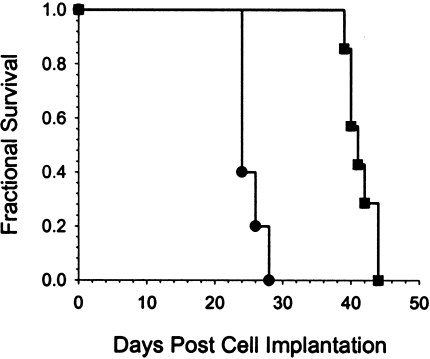
Current assessment of orthotopic tumor models in animals utilizes survival as the primary therapeutic end point. In vivo bioluminescence imaging (BLI) is a sensitive imaging modality that is rapid and accessible, and may comprise an ideal tool for evaluating antineoplastic therapies. Using human tumor cell lines constitutively expressing luciferase, the kinetics of tumor growth and response to therapy have been assessed in intraperitoneal, and subcutaneous, and intravascular cancer models. However, use of this approach for evaluating orthotopic tumor models has not been demonstrated. In this report, the ability of BLI to noninvasively quantitate the growth and therapeutic-induced cell kill of orthotopic rat brain tumors derived from 9L gliosarcoma cells genetically engineered to stably express firefly luciferase (9LLuc) was investigated. Intracerebral tumor burden was monitored over time by quantitation of photon emission and tumor volume using a cryogenically cooled CCD camera and magnetic resonance imaging (MRI), respectively. There was excellent correlation (r=0.91) between detected photons and tumor volume. A quantitative comparison of tumor cell kill determined from serial MRI volume measurements and BLI photon counts following 1,3-bis(2-chloroethyl)-1-nitrosourea (BCNU) treatment revealed that both imaging modalities yielded statistically similar cell kill values (P=.951). These results provide direct validation of BLI imaging as a powerful and quantitative tool for the assessment of antineoplastic therapies in living animals.


Figures

Figure 1
Figure 1
Kinetics of intracranial glioma growth in a representative animal. 9LLuc cells were implanted intracerebrally at 16 days before sham treatment with ethanol vehicle and tumor progression was monitored with MRI (A) and BLI (B). The days, post-sham treatment, on which the images were obtained are indicated at the top. The MR images are T2-weighted and are of a representative slice from the multislice dataset. The scale to the right of the BL images describes the color map for the luminescent signal. Correlation of tumor volume with in vivo photon emission is shown where tumor volume was measured from T2-weighted MR images and plotted against total measured photon counts (C). The relationship between the two measurements was defined by regression analysis (r=0.91).
Figure 2
Figure 2
Temporal analysis of the response of a 9LLuc tumor to BCNU chemotherapy. Tumor cells were implanted 16 days before treatment. Tumor volume was monitored with T2-weighted MRI (A) and intratumoral luciferase activity was monitored with BLI (B). The days post-BCNU therapy on which the images were obtained are indicated at the top. The scale to the right of the BL images describes the color map for the photon count. Quantitative analysis of tumor progression and response to BCNU chemotherapy (C). Tumor volumes (●) and total tumor photon emission (■) obtained by T2-weighted MRI and BLI, respectively, are plotted versus days post-BCNU treatment. The dashed lines are the regression fits of the exponential tumor repopulation following therapy. The solid vertical lines denote the apparent tumor-volume and photon-production losses elicited by BCNU on the day of treatment from which log cell kill values were calculated as previously described [9]. Comparison of log cell kill values determined from MRI and BLI measurements (D). Log cell kill elicited by BCNU chemotherapy was calculated using MRI (1.78±0.36) and BLI (1.84±0.73). Data are represented as mean±SEM for each animal (n=5). There was no statistically significant difference between the log kills calculated using the MRI and BLI data (P=.951).
Figure 3
Figure 3
Kaplan-Meier survival analysis of 1xLD10 BCNU-treated (■) and sham-treated control (●) animals. The mean survival times were 41.0±0.7 and 25.2±7.5 days, respectively, for the treated and control groups (mean±SEM, n=5). There was a statistically significant increased life span in the treated animals (P=.007 Mantel-Cox logrank test).

References

    1. Contag CH, Jenkins D, Contag PR, Negrin RS. Use of reporter genes for optical measurements of neoplastic disease in vivo. Neoplasia. 2000;2:41–52. - PMC - PubMed
    1. Sweeney TJ, Mailander V, Tucker AA, Olomu AB, Zhang W, Cao Y, Negrin RS, Contag CH. Visualizing the kinetics of tumor-cell clearance in living animals. Proc Natl Acad Sci USA. 1999;96:12044–12049. - PMC - PubMed
    1. Edinger M, Sweeney TJ, Tucker AA, Olomu AB, Negrin RS, Contag CH. Noninvasive assessment of tumor cell proliferation in animal models. Neoplasia. 1999;1:303–310. - PMC - PubMed
    1. Curt GA. The use of animal models in cancer drug discovery and development. Stem Cells. 1994;12:23–29. - PubMed
    1. Dong Z, Radinsky R, Fan D, Tsan R, Bucana CD, Wilmanns C, Fidler IJ. Organ-specific modulation of steady-state mdr gene expression and drug resistance in murine colon cancer cells. J Natl Cancer Inst. 1994;86:913–920. - PubMed

Publication types