

Pseudo-spikes are common in histologically benign lymphoid tissues
- PMID: 11229519
- PMCID: PMC1906903
- DOI: 10.1016/S1525-1578(10)60630-7
Pseudo-spikes are common in histologically benign lymphoid tissues
Abstract
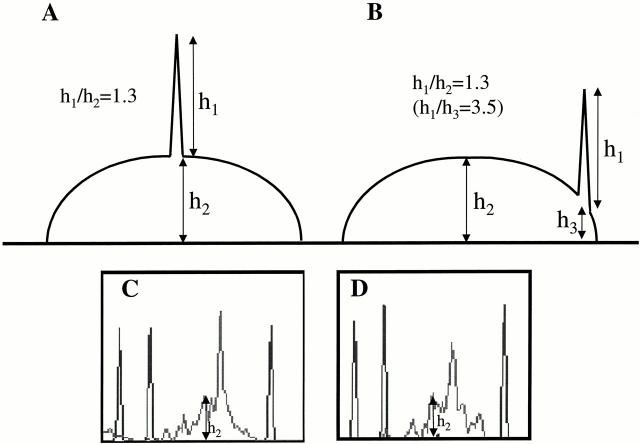
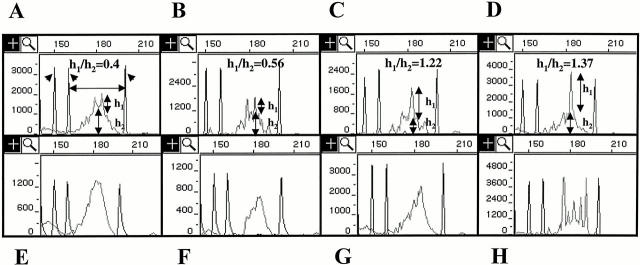
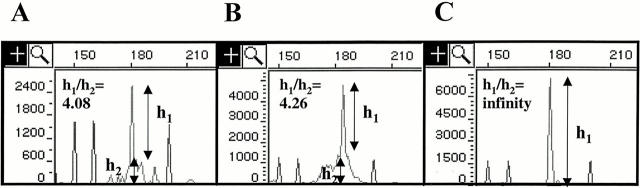
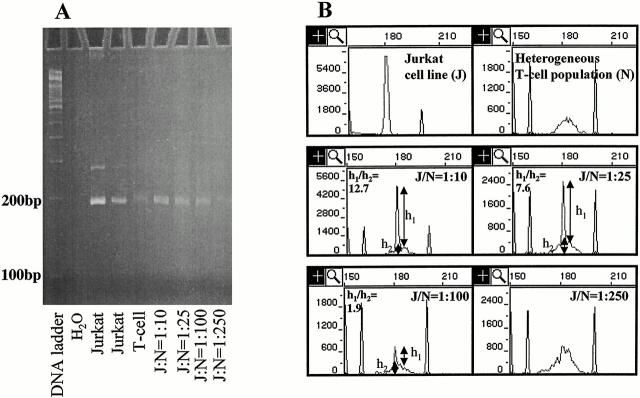
T cell receptor gene rearrangement is a classic marker of T cell clonality and is a useful adjunct in the diagnosis of T cell lymphomas and leukemias. Rearranged V-J gene segments amplified by polymerase chain reaction (PCR) are traditionally analyzed by polyacrylamide gel electrophoresis. We and others have analyzed TCR-gamma PCR products using capillary gel electrophoresis, which produces single nucleotide resolution and provides improved diagnostic sensitivity over conventional methods. However, with this marked increase in resolution and sensitivity, it is necessary to re-define normal variation of TCR-gamma gene rearrangement in control tissues to allow appropriate interpretation of monoclonality if present. Using DNA capillary gel electrophoresis, we examined the spectrum of normal patterns for TCR-gamma in a variety of T-cell-rich, histologically benign tissue types, including spleen, lymph node, tonsil, and blood, and compared this with the patterns in T cell lymphoma samples. We defined relative peak heights as h1/h2, where h1 represents the peak height of the largest peak above the normally distributed population, and h2 represents the peak height of the normally distributed curve. We found spikes in almost 20% of histologically benign samples with relative peak heights that were more than 0.5 and up to 1.5. We designated these as pseudo-spikes, because they may be mistaken for monoclonal spikes. In contrast, the relative peak height of the T cell lymphoma samples that showed clonal rearrangement was much higher than that of the pseudo-spikes, being at least 2 in 11/11 and at least 3 in 10/11 cases. Our data suggest that peaks with relative height of at least 3 represent a true clonal population in diagnostic samples. Peaks with relative heights of less than 1.5 may be insignificant, while peaks with relative heights between 1.5 to 3 may warrant further evaluation. Although capillary gel electrophoresis is superior in assessing T cell clonality, caution must be exercised when interpreting results, because pseudo-spikes appear to be common in benign tissues with lymphoid populations and are not necessarily indicative of clonal malignant T cell population.
Figures
Similar articles
-
Detection of clonal T-cell receptor gamma gene rearrangements using fluorescent-based PCR and automated high-resolution capillary electrophoresis.Mol Diagn. 2001 Sep;6(3):169-79. doi: 10.1054/modi.2001.27056. Mol Diagn. 2001. PMID: 11571710
-
A rapid restriction fragment length polymorphism polymerase chain reaction-based diagnostic method for identification of T-cell lymphoproliferative disorders.J Surg Res. 1999 Aug;85(2):311-6. doi: 10.1006/jsre.1999.5594. J Surg Res. 1999. PMID: 10423334
-
T-cell clonality determination using polymerase chain reaction (PCR) amplification of the T-cell receptor gamma-chain gene and capillary electrophoresis of fluorescently labeled PCR products.Am J Clin Pathol. 2000 Jun;113(6):838-50. doi: 10.1309/02M7-5JCC-YRTK-MGDR. Am J Clin Pathol. 2000. PMID: 10874885
-
GeneScan analysis to detect clonality of T-cell receptor γ gene rearrangement in feline lymphoid neoplasms.Vet Immunol Immunopathol. 2012 Jan 15;145(1-2):402-9. doi: 10.1016/j.vetimm.2011.12.015. Epub 2011 Dec 26. Vet Immunol Immunopathol. 2012. PMID: 22261505
-
The value of molecular analysis by PCR in the diagnosis of cutaneous lymphocytic infiltrates.J Cutan Pathol. 2002 Sep;29(8):447-52. doi: 10.1034/j.1600-0560.2002.290801.x. J Cutan Pathol. 2002. PMID: 12207737 Review.
Cited by
-
Comparative investigations of T cell receptor gamma gene rearrangements in frozen and formalin-fixed paraffin wax-embedded tissues by capillary electrophoresis.J Clin Pathol. 2006 Jun;59(6):645-54. doi: 10.1136/jcp.2005.025809. Epub 2006 Feb 6. J Clin Pathol. 2006. PMID: 16461809 Free PMC article.
-
Effectiveness of capillary electrophoresis using fluorescent-labeled primers in detecting T-cell receptor gamma gene rearrangements.J Mol Diagn. 2002 Aug;4(3):137-43. doi: 10.1016/s1525-1578(10)60694-0. J Mol Diagn. 2002. PMID: 12169674 Free PMC article.
-
Analysis of immunoglobulin and T cell receptor gene rearrangement in the bone marrow of lymphoid neoplasia using BIOMED-2 multiplex polymerase chain reaction.Int J Med Sci. 2013 Aug 31;10(11):1510-7. doi: 10.7150/ijms.5342. eCollection 2013. Int J Med Sci. 2013. PMID: 24046525 Free PMC article.
-
CloneRetriever: An Automated Algorithm to Identify Clonal B and T Cell Gene Rearrangements by Next-Generation Sequencing for the Diagnosis of Lymphoid Malignancies.Clin Chem. 2021 Nov 1;67(11):1524-1533. doi: 10.1093/clinchem/hvab141. Clin Chem. 2021. PMID: 34491318 Free PMC article.
-
A novel method for interpretation of T-cell receptor gamma gene rearrangement assay by capillary gel electrophoresis based on normal distribution.J Mol Diagn. 2007 Feb;9(1):12-9. doi: 10.2353/jmoldx.2007.060032. J Mol Diagn. 2007. PMID: 17251331 Free PMC article.
References
-
- Davis MM, Bjorkman PJ: T-cell antigen receptor genes and T-cell recognition Nature 1988 (published erratum appears in Nature 1988, 335:744), 34:395-402 - PubMed
-
- Saito H, Kranz DM, Takagaki Y, Hayday AC, Eisen HN, Tonegawa S: Complete primary structure of a heterodimeric T-cell receptor deduced from cDNA sequences. Nature 1984, 309:757-762 - PubMed
-
- Strominger JL: Developmental biology of T cell receptors. Science 1989, 244:943-950 - PubMed
-
- LeFranc MP, Forster A, Baer R, Stinson MA, Rabbitts TH: Diversity and rearrangement of the human T cell rearranging gamma genes: nine germ-line variable genes belonging to two subgroups. Cell 1986, 45:237-246 - PubMed
-
- Benhattar J, Delacretaz F, Martin P, Chaubert P, Costa J: Improved polymerase chain reaction detection of clonal T-cell lymphoid neoplasms. Diagn Mol Pathol 1995, 4:108-112 - PubMed
MeSH terms
LinkOut - more resources
Full Text Sources
