

Simultaneous measurement of denitrification and nitrogen fixation using isotope pairing with membrane inlet mass spectrometry analysis
- PMID: 11229907
- PMCID: PMC92710
- DOI: 10.1128/AEM.67.3.1171-1178.2001
Simultaneous measurement of denitrification and nitrogen fixation using isotope pairing with membrane inlet mass spectrometry analysis
Abstract
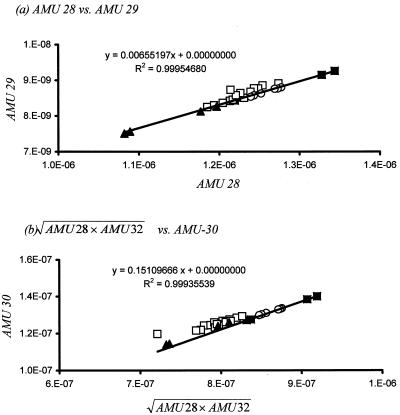
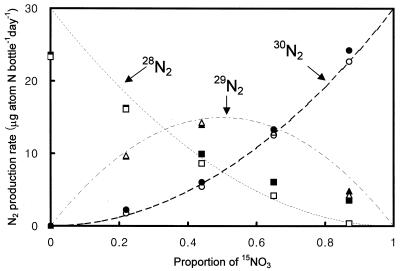
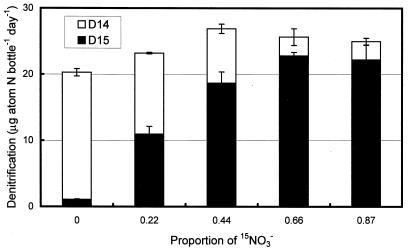
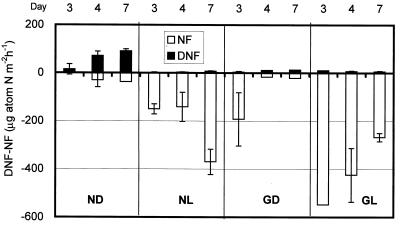
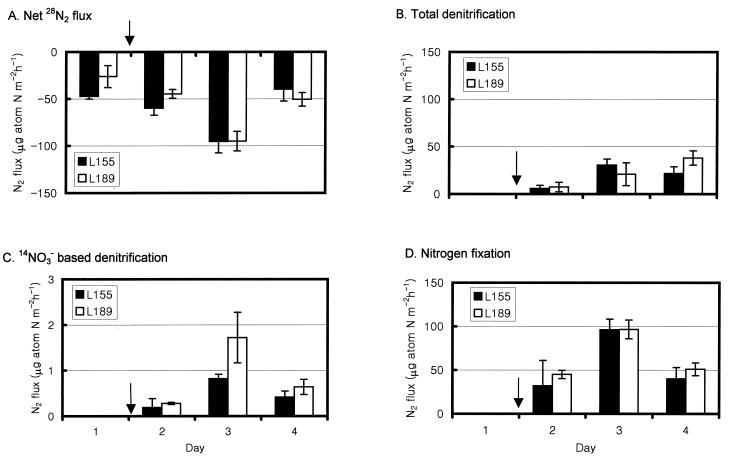
A method for estimating denitrification and nitrogen fixation simultaneously in coastal sediments was developed. An isotope-pairing technique was applied to dissolved gas measurements with a membrane inlet mass spectrometer (MIMS). The relative fluxes of three N(2) gas species ((28)N(2), (29)N(2), and (30)N(2)) were monitored during incubation experiments after the addition of (15)NO(3)(-). Formulas were developed to estimate the production (denitrification) and consumption (N(2) fixation) of N(2) gas from the fluxes of the different isotopic forms of N(2). Proportions of the three isotopic forms produced from (15)NO(3)(-) and (14)NO(3)(-) agreed with expectations in a sediment slurry incubation experiment designed to optimize conditions for denitrification. Nitrogen fixation rates from an algal mat measured with intact sediment cores ranged from 32 to 390 microg-atoms of N m(-2) h(-1). They were enhanced by light and organic matter enrichment. In this environment of high nitrogen fixation, low N(2) production rates due to denitrification could be separated from high N(2) consumption rates due to nitrogen fixation. Denitrification and nitrogen fixation rates were estimated in April 2000 on sediments from a Texas sea grass bed (Laguna Madre). Denitrification rates (average, 20 microg-atoms of N m(-2) h(-1)) were lower than nitrogen fixation rates (average, 60 microg-atoms of N m(-2) h(-1)). The developed method benefits from simple and accurate dissolved-gas measurement by the MIMS system. By adding the N(2) isotope capability, it was possible to do isotope-pairing experiments with the MIMS system.
Figures
References
-
- An S, Joye S B. An improved chromatographic method to measure nitrogen, oxygen, argon and methane in gas or liquid samples. Mar Chem. 1997;59:63–70.
-
- An S, Joye S B. Enhancement of coupled nitrification-denitrification by benthic photosynthesis in shallow estuarine sediments. Limnol Oceanogr. 2001;46:42–47.
-
- Anderson T K, Hensen M H, Sørensen J. Diurnal variation in nitrogen cycling in coastal marine sediments. I. Denitrification. Mar Biol. 1984;83:171–176.
-
- Anette P, Risgaard-Petersen N, Revsbech N P. Denitrification and microphytobenthic NO3 consumption in a Danish lowland stream: diurnal and seasonal variation. Aquat Microb Ecol. 1997;12:275–284.
-
- Bender L M, Tans P P, Ellis T, Orchardo J, Habfast K. A high precision isotope ratio mass spectrometer method for measuring the O2/N2 ratio of air. Geochim Cosmochim Acta. 1994;58:4751–4758.
Publication types
MeSH terms
Substances
LinkOut - more resources
Full Text Sources
Miscellaneous
