. 2001 Mar 1;20(5):990-7.
doi: 10.1093/emboj/20.5.990.

Crystal structure of the Lrp-like transcriptional regulator from the archaeon Pyrococcus furiosus

Affiliations

Crystal structure of the Lrp-like transcriptional regulator from the archaeon Pyrococcus furiosus

P M Leonard et al. EMBO J. .

Abstract

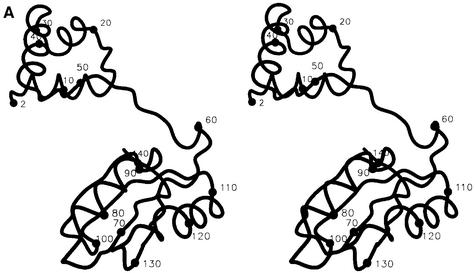
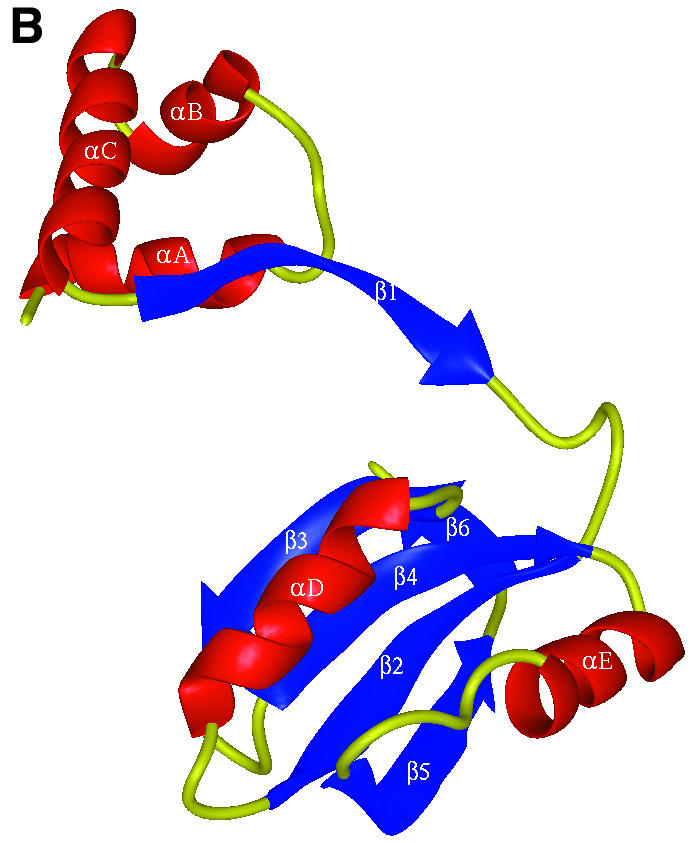
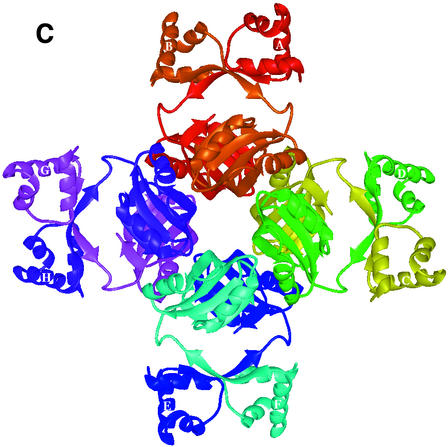
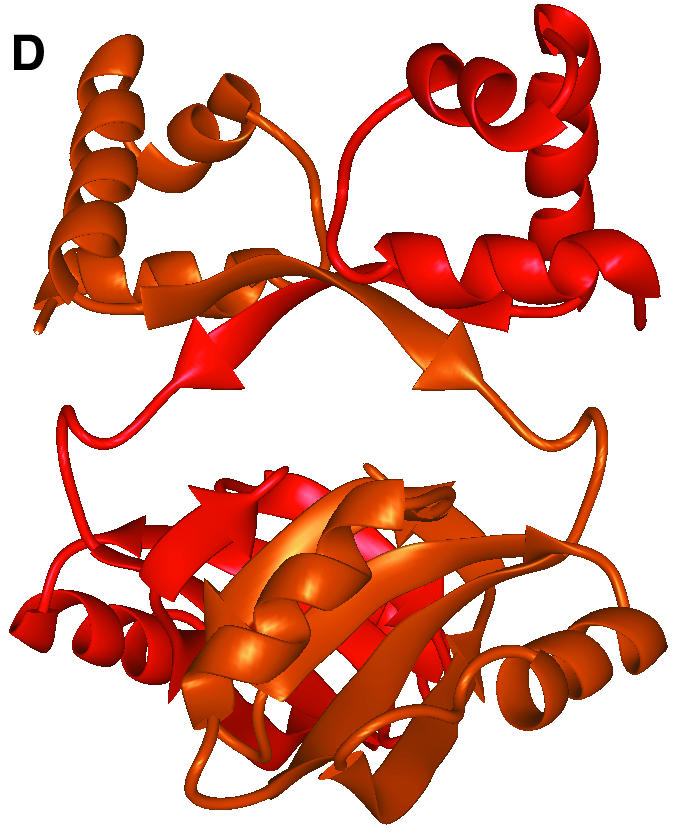
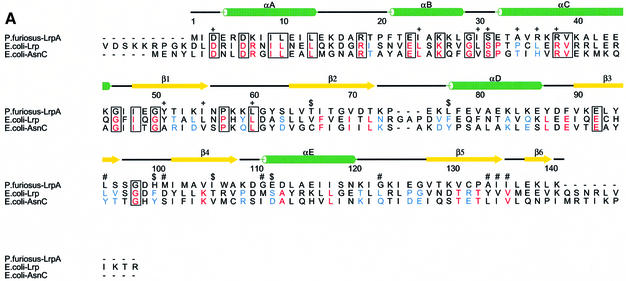
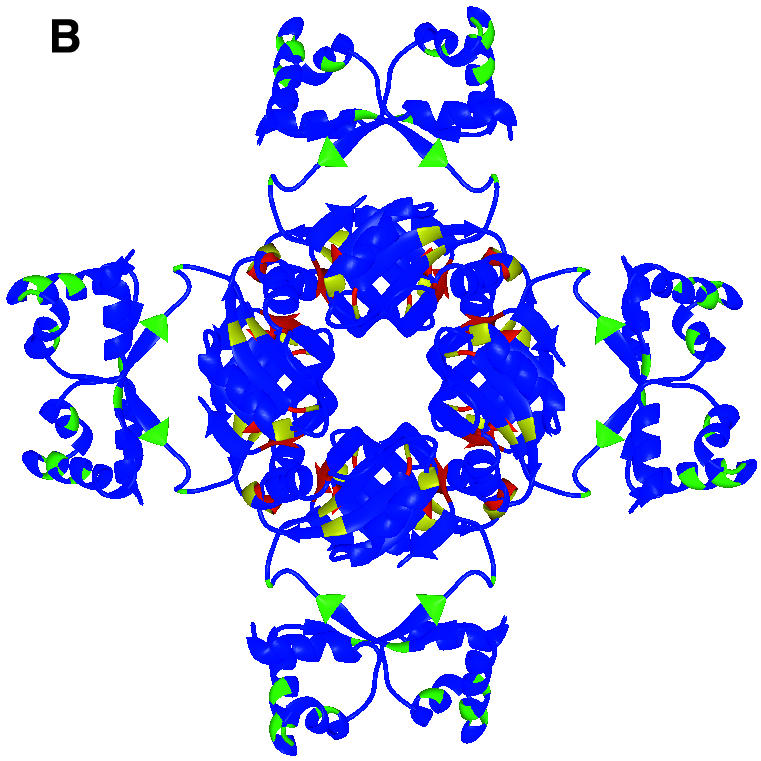
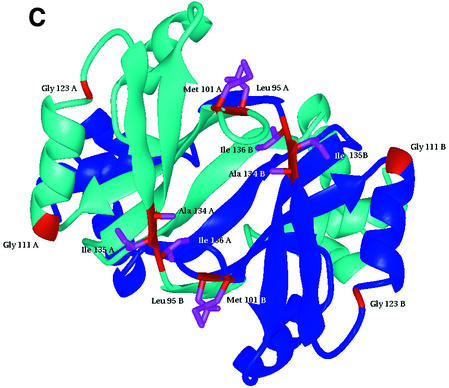
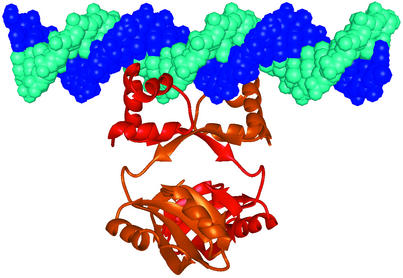
The LrpA protein from the hyperthermophilic archaeon Pyrococcus furiosus belongs to the Lrp/AsnC family of transcriptional regulatory proteins, of which the Escherichia coli leucine-responsive regulatory protein is the archetype. Its crystal structure has been determined at 2.9 A resolution and is the first for a member of the Lrp/AsnC family, as well as one of the first for a transcriptional regulator from a hyperthermophile. The structure consists of an N-terminal domain containing a helix-turn-helix (HtH) DNA-binding motif, and a C-terminal domain of mixed alpha/beta character reminiscent of a number of RNA- and DNA-binding domains. Pyrococcus furiosus LrpA forms a homodimer mainly through interactions between the antiparallel beta-sheets of the C-terminal domain, and further interactions lead to octamer formation. The LrpA structure suggests how the protein might bind and possibly distort its DNA substrate through use of its HtH motifs and control gene expression. A possible location for an effector binding site is proposed by using sequence comparisons with other members of the family coupled to mutational analysis.


Figures

None
Fig. 1. The overall fold of P.furiosus LrpA. (A) Schematic stereo representation of the Cα backbone of a monomer with every 10th residue labelled. (B) Schematic representation of the fold of a monomer with α-helices and β-strands shown as labelled coils and arrows (red and blue, respectively). (C) The LrpA octamer viewed as in (B) but with subunits labelled A–H and coloured red, orange, yellow, green, blue, cyan, violet and purple, respectively. (D) Schematic representation of the fold of a dimer with the two monomers shown in red and orange. [Figures were produced using MIDAS (Ferrin et al., 1988)].
None
Fig. 2. Sequence alignment and location of DNA binding, activation and leucine response mutations. (A) Structure-based multiple alignment of Lrp/AsnC family sequences. Elements of secondary structure in LrpA are shown as labelled cylinders (α-helices) and arrows (β-strands). Sequences are aligned from P.furiosus LrpA, E.coli Lrp and E.coli AsnC. Residues that are conserved across all three sequences have been boxed. Those residues that are conserved between Lrp and AsnC are shaded red. Those residues that are switched from a hydrophobic side chain in Lrp to a hydrophilic side chain in AsnC are shaded blue. The positions of the E.coli Lrp DNA binding mutants, activation mutants and leucine response mutants are indicated by the symbols +, $ and #, respectively. [The figure was produced using CINEMA (Parry-Smith et al., 1998) and ALSCRIPT (Barton, 1993)]. (B) The LrpA octamer as shown in Figure 1C but with all subunits coloured blue. The positions of DNA binding mutants, activation mutants and leucine response mutants are shown in green, yellow and red, respectively. (C) An LrpA dimer viewed along its 2-fold axis (i.e. rotated 90° around the x-axis with respect to Figure 1D). The monomers are shown in blue and cyan and the equivalent residues in LrpA to those identified in E.coli Lrp as leucine response mutants are shown in red with magenta side chains. The residue sequence numbers are those of LrpA. [(B) and (C) were produced using MIDAS (Ferrin et al., 1988)].
None
Fig. 3. Modelling of DNA binding by LrpA. A straight piece of B-form DNA modelled onto an LrpA dimer such that the 2-fold axis of the dimer is coincident with a local 2-fold in the DNA and the two recognition helices access adjacent turns of the major groove. [The figure was produced using MIDAS (Ferrin et al., 1988)].

Similar articles

Cited by

References

    1. Barton G.J. (1993) Alscript: a tool to format multiple sequence alignments. Protein Eng., 6, 37–40. - PubMed
    1. Bell S.D. and Jackson,S.P. (1998) Transcription and translation in Archaea: a mosaic of eukaryal and bacterial features. Trends Microbiol., 6, 222–228. - PubMed
    1. Bernstein F.C. and Tasumi,M. (1977) The Protein Data Bank: a computer based archival file for macromolecular structures. J. Mol. Biol., 112, 535–542. - PubMed
    1. Brinkman A.B. et al. (2000) An lrp-like transcriptional regulator from the archaeon Pyrococcus furiosus is negatively autoregulated. J. Biol. Chem., 275, 38160–38169. - PubMed
    1. Brunger A.T. (1992) Free R-value—a novel statistical quantity for assessing the accuracy of crystal structures. Nature, 355, 472–475. - PubMed

Publication types

MeSH terms

Associated data