Comparative Study
. 2001 Mar 1;531(Pt 2):545-57.
doi: 10.1111/j.1469-7793.2001.0545i.x.

Transcranial magnetic stimulation and stretch reflexes in the tibialis anterior muscle during human walking

Affiliations
Comparative Study

Transcranial magnetic stimulation and stretch reflexes in the tibialis anterior muscle during human walking

L O Christensen et al. J Physiol. .

Abstract

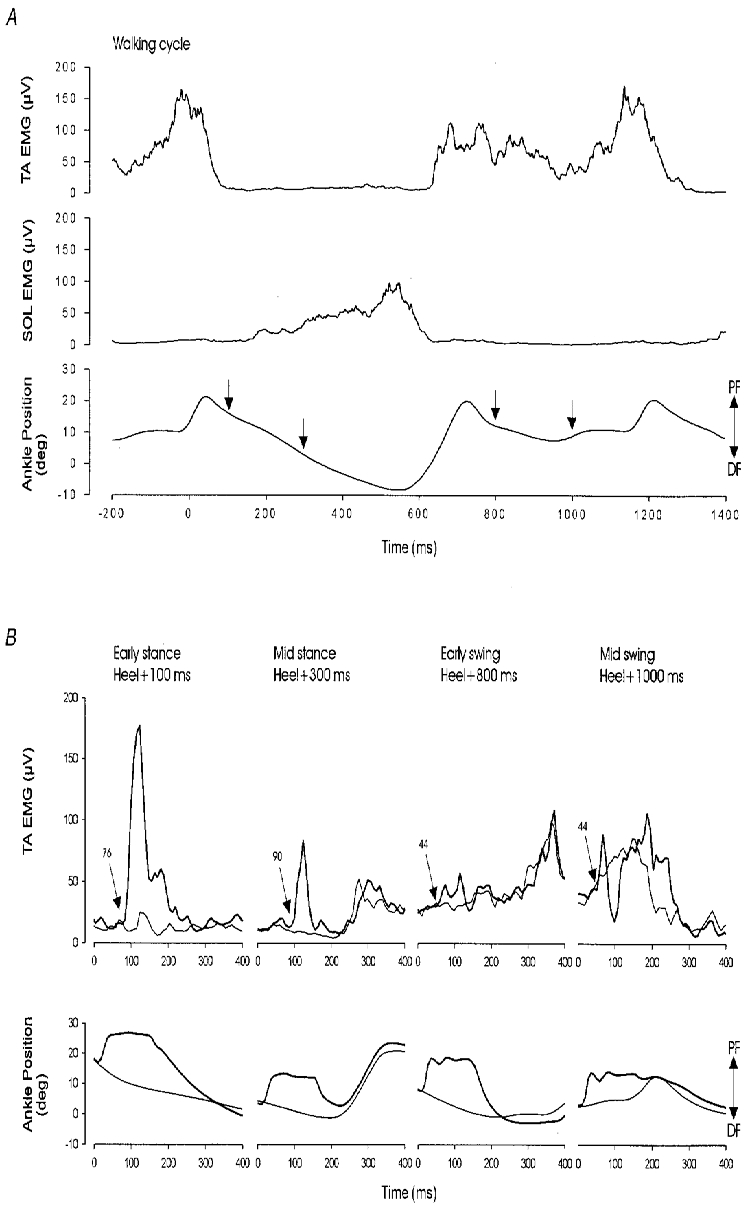
Stretch of the ankle dorsiflexors was applied at different times of the walking cycle in 17 human subjects. When the stretch was applied in the swing phase, only small and variable reflex responses were observed in the active tibialis anterior (TA) muscle. Two of the reflex responses that could be distinguished had latencies which were comparable with the early (M1) and late (M3)components of the three reflex responses (M1, M2 and M3) observed during tonic dorsiflexion in sitting subjects. In the stance phase a single very large response was consistently observed in the inactive TA muscle. The peak of this response had the same latency as the peak of M3, but in the majority of subjects the onset latency was shorter than that of M3. The TA reflex response in the stance phase was abolished by ischaemia of the lower leg at the same time as the soleus H-reflex, suggesting that large muscle afferents were involved in the generation of the response. Motor-evoked potentials (MEPs) elicited in the TA by transcranial magnetic stimulation (TMS) were strongly facilitated corresponding to the peak of the stretch response in the stance phase and the late reflex response in the swing phase. A similar facilitation was not observed corresponding to the earlier responses in the swing phase and the initial part of the response in stance. Prior stretch did not facilitate MEPs evoked by transcranial electrical stimulation in the swing phase of walking. However, in the stance phase MEPs elicited by strong electrical stimulation were facilitated by prior stretch to the same extent as the MEPs evoked by TMS. The large responses to stretch seen in the stance phase are consistent with the idea that stretch reflexes are mainly involved in securing the stability of the supporting leg during walking. It is suggested that a transcortical reflex pathway may be partly involved in the generation of the TA stretch responses during walking.


Figures

Figure 1
Figure 1. Modulation of TA stretch responses during the walking cycle
Stretches (amplitude 8 deg, velocity 250 deg s−1 and a hold phase of ≈120 ms) were applied to the ankle dorsiflexors by a portable stretching device at different times during the walking cycle. In A the EMG pattern in TA (upper traces) and soleus (middle traces) together with the changes in ankle joint position (lower traces) during the full walking cycle are shown. The arrows mark the time of the stretches described in B. The EMG responses in TA to the stretches are shown in the top traces in B (thick lines). The onset of the responses are marked by arrows together with the latency in milliseconds. The changes in the position of the ankle joint are shown below. The thin lines show the EMG activity and the ankle joint position in control steps without stretch. The stretches were applied at different delays in relation to the time of heel contact. In the graphs to the far left the stretch was applied 100 ms after heel contact (early stance); in the following graphs it was applied 300 ms after heel contact (mid stance), then 800 ms after heel contact (early swing) and finally 1000 ms after heel contact in the graphs to the far right (mid swing). All the traces consist of an average of 10 sweeps, while time zero in B corresponds to the triggering of the stretch device. PF and DF (plantar and dorsiflexion, respectively) signify the movement direction.
Figure 2
Figure 2. Comparison of TA stretch responses during the walking cycle and during tonic dorsiflexion in a sitting subject
In A-D data from a single subject are shown. In A the response in the TA EMG evoked by stretch in the early stance phase (100 ms after heel contact; stretch velocity 109 deg s−1) is shown, whereas B and C show the responses to stretch in the early swing phase (700 ms after heel contact; stretch velocity 161 deg s−1) and during tonic dorsiflexion (stretch velocity 114 deg s−1). The positional records are shown in D. The tonic dorsiflexion was recorded with the subject sitting down and performing a dorsiflexion against a resistance. The subject was asked to produce a similar amount of TA EMG activity to that in early swing. The stretches applied all had an amplitude of ≈8 deg and a hold phase ≈200 ms. All traces are the average of 10 sweeps. Time zero corresponds to stretch onset.
Figure 3
Figure 3. Comparison of late TA stretch responses in different subjects
In A and B the TA EMG responses evoked by stretch of the ankle dorsiflexors from two different subjects in early stance are shown together with the positional records (100 ms after heel contact; all traces are the average of 10 sweeps and time zero corresponds to stretch onset). The subject in A had a latency to onset of the response of 73 ms (stretch velocity 119 deg s−1) and peaks at both 95 and 107 ms (in this case a broad peak extending to 117 ms), while the subject in B had a latency to onset of 89 ms (stretch velocity 156 deg s−1) and a peak at 108 ms. In C, data from the eight subjects in whom a comparison between walking and tonic dorsiflexion were made, are shown. The graph shows the latency of the peak of the response recorded in the early stance phase as compared with the latency of the peak of M3 in each of the subjects. The line is a regression line with a slope of 1 and origin in (90,90), showing only minor deviations from identical latencies.
Figure 4
Figure 4. The effect of ischaemia on the TA stretch response in early stance
The data are from a single subject. Ischaemia was induced by inflating a cuff, placed above the patella, to ≈240 mmHg. A comparison of the response in the TA EMG to stretch of the ankle dorsiflexors before (A; pre-ischaemia) and 20 min after inflation of the cuff (B; ischaemia) is shown. The thick lines are the average of 10 sweeps with a stretch of 8 deg, a hold phase of ≈120 ms and stretch velocities of 419 and 415 deg s−1, respectively. The thin lines are the background EMG. Time zero corresponds to stretch onset.
Figure 5
Figure 5. Stretch-induced facilitation of TA MEPs elicited by TMS
A and B show data from a single subject, whereas C and D show mean data from all nine investigated subjects. A and C show early stance phase (100-200 ms after heel contact), whereas B and D show the early swing phase (700-800 ms after heel contact). In all cases TMS was adjusted to evoke an MEP in the TA EMG, which was just above threshold. The stretches used had an amplitude of 8 deg, a hold phase of ≈200 ms and velocities of ≈300 deg s−1 in both the stance and swing phase. The upper traces in A and B show the response in the TA EMG to combined stretch and TMS (thick line) and the response to TMS alone (thin line) when the stretch preceded TMS by 30 ms (left) and 76 ms (right). The arrows indicate the time of stretch onset (filled arrow) and TMS (open arrow). The lower traces show the response to stretch when applied alone (thick traces) as compared with the background EMG activity (thin traces). In all nine investigated subjects the size of the response to combined stretch and TMS was expressed as a percentage of the algebraic sum of the responses to separate stretch and TMS for each investigated interval between the stretch and TMS. The mean data from all subjects were calculated. The graphs in C and D show the result of this for each conditioning-test interval in the stance (C) and swing phase (D), respectively. The vertical bars are s.d.⋆, a statistically significant difference (P < 0.05) between the response to combined stretch and TMS as compared with the algebraic sum of the responses to separate stretch and TMS.
Figure 6
Figure 6. Comparison of stretch-induced facilitation of MEPs evoked by transcranial magnetic and electrical stimulation
TA MEPs were evoked by transcranial magnetic (A and B) and electrical (C and D) stimulation in the early stance (A and C) and early swing (B and D) phases of walking. The intensity of the stimuli were adjusted to evoke MEPs with almost equal amplitudes in both stance and swing. The intensity of the electrical stimulus was 22 % of the maximal stimulator output in swing and 31 % in stance, whereas the intensity of the magnetic stimulus was 50 % in both phases. The traces show the average of 10 sweeps following either combined stretch and transcranial stimulation (thick lines) or transcranial stimulation alone (thin lines). Conditioning-test intervals of 70 and 72 ms were used for TMS and TES, respectively, as marked by the open arrows. Time zero corresponds to stretch onset (filled arrows). The stretch had an amplitude of 8 deg, a hold phase of ≈200 ms and velocities of ≈280 deg s−1 in both the stance and swing phase.

References

    1. Andersen JB, Sinkjaer T. An actuator system for investigating electrophysiological and biomechanical features around the human ankle joint during gait. Transaction on Rehabilitation Engineering. 1995;3:299–306.
    1. Andersson O, Forssberg H, Grillner S, Wallen P. Peripheral feedback mechanisms acting on the central pattern generators for locomotion in fish and cat. Canadian The Journal of Physiology and Pharmacology. 1981;59:713–26. - PubMed
    1. Capaday C, Lavoie BA, Barbeau H, Schneider C, Bonnard M. Studies on the corticospinal control of human walking. I. Responses to focal transcranial magnetic stimulation of the motor cortex. Journal of Neurophysiology. 1999;81:129–139. - PubMed
    1. Capaday C, Stein RB. Amplitude modulation of the soleus H-reflex in the human during walking and standing. Journal of Neuroscience. 1986;6:1308–1313. - PMC - PubMed
    1. Corna S, Grasso M, Nardone A, Schieppati M. Selective depression of medium-latency leg and foot muscle responses to stretch by an α2-agonist in humans. The Journal of Physiology. 1995;484:803–809. - PMC - PubMed

Publication types

LinkOut - more resources