. 2001 Mar;7(3):331-7.
doi: 10.1038/85480.

Persistently modified h-channels after complex febrile seizures convert the seizure-induced enhancement of inhibition to hyperexcitability

Affiliations

Persistently modified h-channels after complex febrile seizures convert the seizure-induced enhancement of inhibition to hyperexcitability

K Chen et al. Nat Med. 2001 Mar.

Abstract

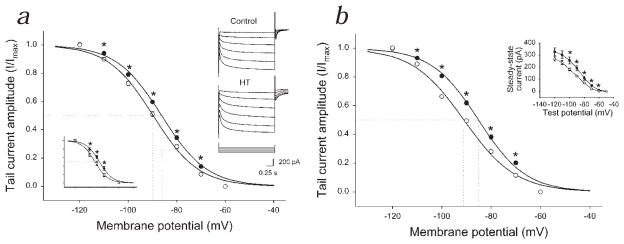
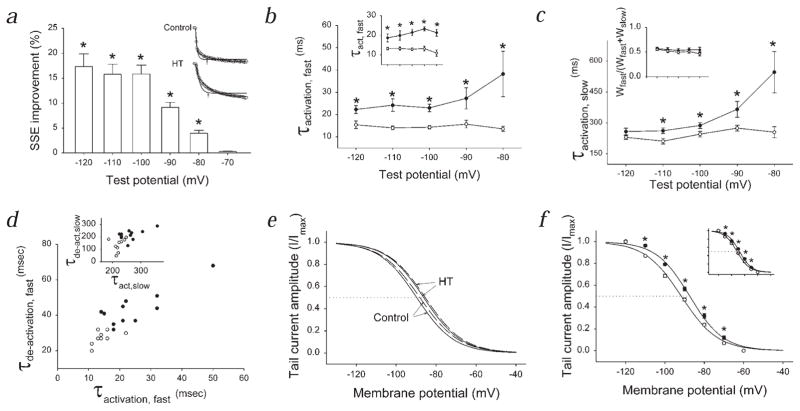
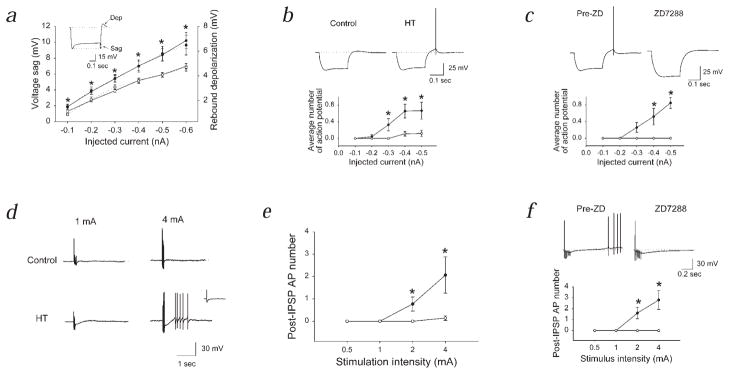
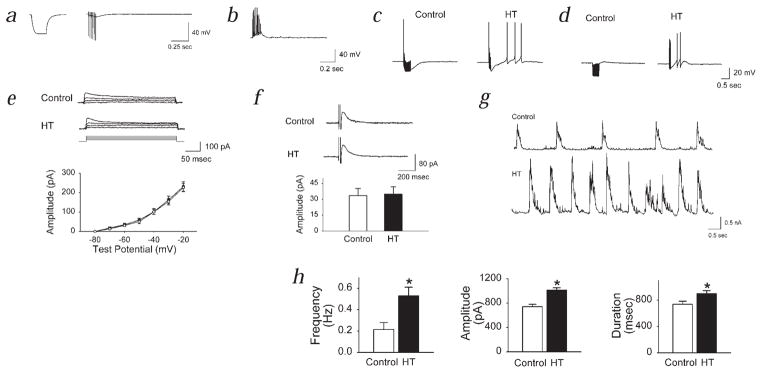
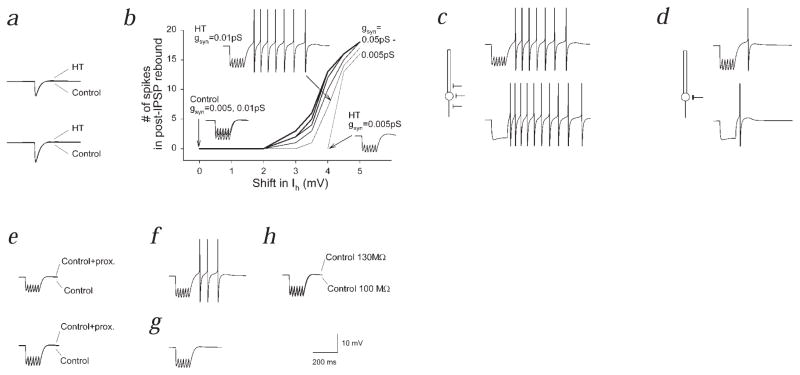
Febrile seizures are the most common type of developmental seizures, affecting up to 5% of children. Experimental complex febrile seizures involving the immature rat hippocampus led to a persistent lowering of seizure threshold despite an upregulation of inhibition. Here we provide a mechanistic resolution to this paradox by showing that, in the hippocampus of rats that had febrile seizures, the long-lasting enhancement of the widely expressed intrinsic membrane conductance Ih converts the potentiated synaptic inhibition to hyperexcitability in a frequency-dependent manner. The altered gain of this molecular inhibition-excitation converter reveals a new mechanism for controlling the balance of excitation-inhibition in the limbic system. In addition, here we show for the first time that h-channels are modified in a human neurological disease paradigm.


Figures

Fig 1
Fig 1
Long-lasting shift in h-current activation following hyperthermia-induced seizures. a, Ih activation in CA1 cells from animals one week after seizures (●) and sham-treated littermate controls (○). The fitted curve is the Boltzmann function. The data points are normalized per cell and averaged. RS: control, 8.5 ± 1.1 MΩ; HT, 10.1 ± 1.7 MΩ; no difference. The maximal tail current did not increase; at −120 mV: control, 127.6 ± 8.6 pA; HT, 119.1 ± 8.7 pA. The tail current tended to saturate at negative voltages; currents at −120 mV and −110 mV were not statistically different in either group. Right inset, Raw traces; voltage stepped from −40 mV up to −120 mV, then to −60 mV. Left inset, Gramicidin recordings (1 wk post-seizure; RS: control, 40.8 ± 4.6 MΩ; HT, 41.0 ± 3.4 MΩ; no difference). b, Ih activation 9 wk after seizures (●) and in controls (○). RS: control, 9.6 ± 1.0 MΩ; HT, 9.0 ± 1.0 MΩ; no difference). Inset, Steady-state current (following subtraction of instantaneous current; 9 wk after seizures).
Fig. 2
Fig. 2
Kinetic changes in Ih following seizures and the effect of modulation of intracellular cAMP. a, ‘SSE Improvement’ shows that double exponentials provided better fits to Ih at most voltages. Inset, Traces evoked at −110mV; single exponentials (arrows) provided poorer fits than double exponentials. b, Voltage versus fast activation time constants (1 wk after seizures; in bf, control, ○; HT, ●). Inset, Activation kinetics 9 wk following seizures. c, Voltage versus slow activation time constants. Inset, Weights of fast and slow exponential components (wfast and wslow, respectively). d, Fast activation versus fast de-activation rates (data points are mean values from cells at −110 mV). Inset, Slow activation and de-activation time constants. e, Ih activation curves without (continuous lines) and with 1 mM cAMP (dashed lines) in the pipette. f, Ih activation curves in Rp-cAMPS. Inset, Activation curves in propranolol.
Fig. 3
Fig. 3
Enhanced activation of altered Ih by hyperpolarizing inputs and post-inhibitory rebound firing following hyperthermia-induced seizures. a, Intracellularly injected hyperpolarizing current amplitude versus the depolarizing ‘sag’ (left y-axis; continuous lines), and the rebound depolarization ‘dep’; right y-axis; dotted lines). In control ACSF, cells held at −60 mV to avoid rebound firing. b, Rebound firing. Membrane potential: control, −54.1 ± 1.6 mV; HT, −53.3 ± 2.0 mV. In bf, APV, CNQX and SCH50911 were present. c, Block of rebound firing and depolarization by ZD-7288 in cells from HT animals (Pre-ZD, ●; ZD-7288, ○). d, IPSPs (6 stimuli at 50Hz) and rebound firing in HT animals. Inset, Single IPSP. e, Summary data for post-inhibitory firing from experiments similar to those in d (membrane potential: control, −53.3 ± 2.4 mV; HT, −53.4 ± 1.3 mV; the duration of the post-IPSP depolarization was also longer by 321.0 ± 67% in HT. f, Block of post-inhibitory rebound firing by ZD-7288 in HT cells. Throughout this figure (except for c and f): control, ○; HT, ●.
Fig. 4
Fig. 4
Mechanism of post-inhibitory rebound firing, specificity of the changes affecting Ih, and pattern of spontaneous GABA-receptor activation after febrile seizures. a, Block of the sag response and the post-IPSP firing following intracellular application of ZD-7288 (stimulation: as in Fig. 3; hyperpolarization of Vm by extracellular ZD-7288 with intracellular ZD-7288 present, 0.5 ± 0.5 mV, n = 4; without intracellular ZD-7288, 7.3 ± 0.7, n = 8). b, Evoked IPSPs with Cl filled pipettes (ECl = 0 mV). c and d, Rebound firing in HEPES/O2 buffer (c) and in acetazolamide (d). Control, 40 stimuli at 100 Hz; HT, 6 stimuli at 50 Hz. e and f, Lack of a change in ID (e, control, ○; HT, ●) and IAHP (f) after seizures. g and h, Spontaneous IPSCs after experimental febrile seizures (intra-burst IPSC frequency: 95.1 ± 10.6 Hz).
Fig. 5
Fig. 5
Multicompartmental modeling shows importance of altered h-channels in limiting inhibitory inputs and generating post-inhibitory rebound firing. a, Single IPSPs, of smaller (upper panel) or larger amplitude (lower panel), did not result in rebound firing. b, Dependence of rebound firing on shift in Ih and on the strength of inhibition (gsyn). c and d, Dependence of post-inhibitory rebound firing on the position of inhibitory inputs along the somatodendritic axis (c, ‘perisomatic’ inputs; d, ‘somatic’ inputs; upper panels, inhibitory synaptic inputs; lower panels, hyperpolarizing current steps). e, Lack of significant rebound firing following placement of all dendritic h-channels into the most proximal dendritic compartment; upper panel, small IPSPs; lower panel, larger IPSPs. f, Shifted V50 for Ih, but Ih kinetics were kept control-like. g, No shift in V50, but HT-like kinetics. h, Lack of rebound firing when input resistance was decreased (as found experimentally after seizures) in a control model cell.

Similar articles

Cited by

References

    1. Otis TS, De Koninck Y, Mody I. Lasting potentiation of inhibition is associated with an increased number of gamma-aminobutyric acid type A receptors activated during miniature inhibitory postsynaptic currents. Proc Natl Acad Sci USA. 1994;91:7698–702. - PMC - PubMed
    1. Nusser Z, Hájos N, Somogyi P, Mody I. Increased number of synaptic GABA(A) receptors underlies potentiation at hippocampal inhibitory synapses. Nature. 1998;395:172–177. - PubMed
    1. Brooks-Kayal AR, Shumate MD, Jin H, Rikhter TY, Coulter DA. Selective changes in single cell GABAA receptor subunit expression and function in temporal lobe epilepsy. Nature Med. 1998;4:1166–1172. - PubMed
    1. Buhl EH, Otis TS, Mody I. Zinc-induced collapse of augmented inhibition by GABA in a temporal lobe epilepsy model. Science. 1996;271:369–373. - PubMed
    1. Chen K, Baram TZ, Soltesz I. Febrile seizures in the developing brain result in persistent modification of neuronal excitability in limbic circuits. Nature Med. 1999;5:888–894. - PMC - PubMed

Publication types