

The vitamin D receptor polymorphism in the translation initiation codon is a risk factor for insulin resistance in glucose tolerant Caucasians
- PMID: 11231880
- PMCID: PMC29095
- DOI: 10.1186/1471-2350-2-2
The vitamin D receptor polymorphism in the translation initiation codon is a risk factor for insulin resistance in glucose tolerant Caucasians
Abstract
Background: Although vitamin D receptor (VDR) polymorphisms have been shown to be associated with abnormal glucose metabolism, the reported polymorphisms are unlikely to have any biological consequences. The VDR gene has two potential translation initiation sites. A T-to-C polymorphism has been noted in the first ATG (f allele), abolishing the first translation initiation site and resulting in a peptide lacking the first three amino acids (F allele). We examined the role of this polymorphism in insulin sensitivity and beta cell function. This study included 49 healthy Caucasian subjects (28 females, age 28 +/- 1 years old, body mass index 24.57 +/- 0.57 kg/m2, waist-hip ratio 0.81 +/- 0.01 cm/cm). They were all normotensive (less than 140/90 mmHg) and glucose tolerant, which was determined by a standard 75-gm oral glucose tolerance test. Their beta cell function (%B) and insulin sensitivity (%S) were calculated based on the Homeostasis Model Assessment (HOMA). Their genotypes were determined by a polymerase chain reaction-restriction fragment length polymorphism analysis. Phenotypes were compared between genotypic groups.
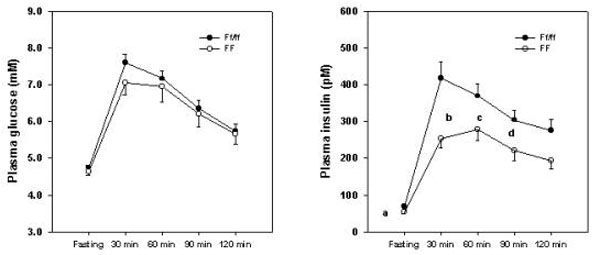
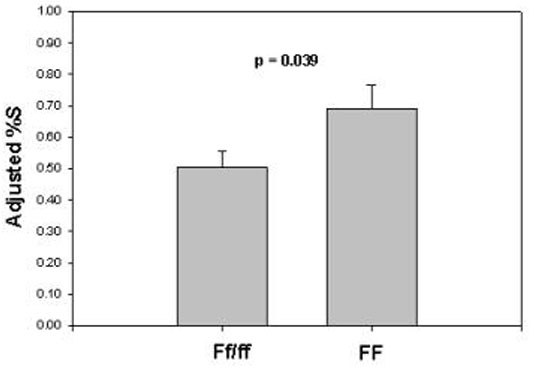
Results: There were 18 FF, 21 Ff, and 10 ff subjects. Since only 10 ff subjects were identified, they were pooled with the Ff subjects during analyses. The FF and Ff/ff groups had similar glucose levels at each time point before and after a glucose challenge. The Ff/ff group had higher insulin levels than the FF group at fasting (P=0.006), 30 minutes (P=0.009), 60 minutes (P=0.049), and 90 minutes (P=0.042). Furthermore, the Ff/ff group also had a larger insulin area under the curve than the FF group (P=0.009). While no difference was noted in %B, the Ff/ff group had a lower %S than the FF group (0.53 vs. 0.78, P=0.006). A stepwise regression analysis confirmed that the Fok I polymorphism was an independent determinant for %S, accounting for 29.3% of variation in %S when combined with waist-hip ratio.
Conclusions: We report that the Fok I polymorphism at the VDR gene locus is associated with insulin sensitivity, but has no influence on beta cell function in healthy Caucasians. Although this polymorphism has been shown to affect the activation of vitamin D-dependent transcription, the molecular basis of the association between this polymorphism and insulin resistance remains to be determined.
Figures
References
-
- Kwon DJ, Kim JH, Chung KW, Lee JW, Kim SP, Lee HY. Bone mineral density of the spine using dual energy X-ray absorptiometry in patients with non-insulin-dependent diabetes mellitus. J Obstet Gynaecol Res. 1996;22:157–162. - PubMed
-
- Van Daele PL, Stolk RP, Burger H, Algra D, Grobbee DE, Hofman A, et al. Bone density in non-insulin-dependent diabetes mellitus. The Rotterdam Study. Ann Intern Med. 1995;122:409–414. - PubMed
-
- Weinstock RS, Goland RS, Shane E, Clemens TL, Lindsay R, Bilezikian JP. Bone mineral density in women with type II diabetes mellitus. J Bone Miner Res. 1989;4:97–101. - PubMed
-
- Barrett-Connor E, Kritz-Silverstein D. Does hyperinsulinemia preserve bone? Diabetes Care. 1996;19:1388–1392. - PubMed
Grants and funding
LinkOut - more resources
Full Text Sources
