. 2001 Feb 15;409(6822):953-8.
doi: 10.1038/35057192.

Integration of cytogenetic landmarks into the draft sequence of the human genome

Affiliations

Integration of cytogenetic landmarks into the draft sequence of the human genome

V G Cheung et al. Nature. .

Abstract

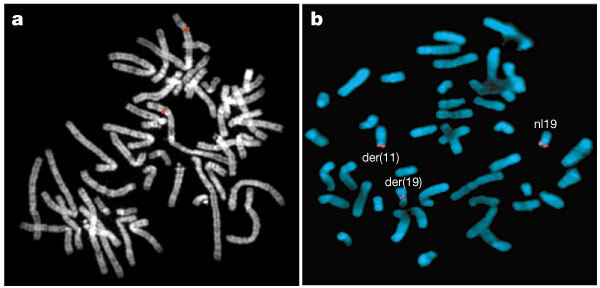
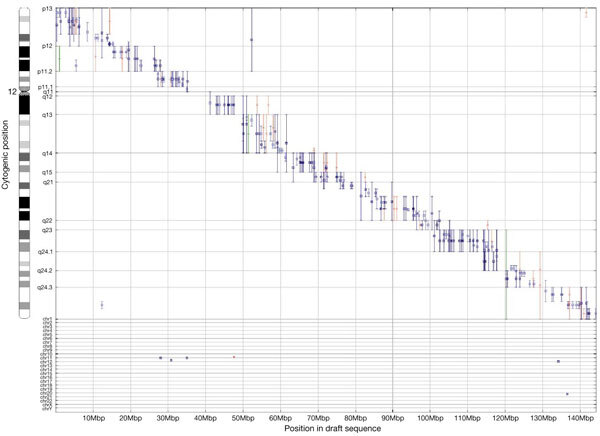
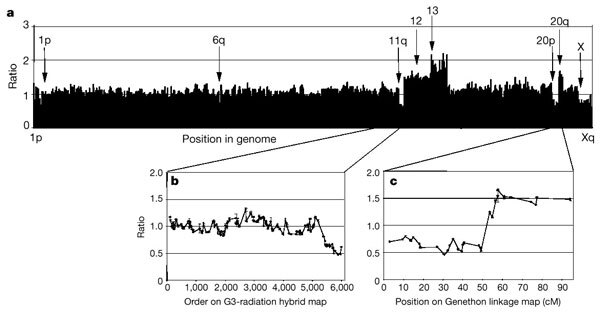
We have placed 7,600 cytogenetically defined landmarks on the draft sequence of the human genome to help with the characterization of genes altered by gross chromosomal aberrations that cause human disease. The landmarks are large-insert clones mapped to chromosome bands by fluorescence in situ hybridization. Each clone contains a sequence tag that is positioned on the genomic sequence. This genome-wide set of sequence-anchored clones allows structural and functional analyses of the genome. This resource represents the first comprehensive integration of cytogenetic, radiation hybrid, linkage and sequence maps of the human genome; provides an independent validation of the sequence map and framework for contig order and orientation; surveys the genome for large-scale duplications, which are likely to require special attention during sequence assembly; and allows a stringent assessment of sequence differences between the dark and light bands of chromosomes. It also provides insight into large-scale chromatin structure and the evolution of chromosomes and gene families and will accelerate our understanding of the molecular bases of human disease and cancer.


Figures

Figure 1
Figure 1. Cytogenetic analyses of sequence-integrated clones.
a, Using FISH, fluorescent signals are observed at cytogenetic bands (grey) where fragments of a sequence-tagged BAC hybridize (red). b, Clones selected on the basis of band location were used in FISH analyses to map the breakpoint of a translocation involving chromosomes 11 and 19 in a patient with multiple congenital malformations and mental retardation (DGAP012, http://dgap.harvard.edu). Clone CTD-3193o13 spans the breakpoint on chromosome 19; red signal is split between the derivative chomosome 11 and derivative 19 chromosomes and is also present on the normal chromosome 19. The GTG-banded karyotype for this patient is 46,XY,t(11;19)(p11.2;p13.3).
Figure 2
Figure 2. The correspondence between cytogenetic location and position on the 7 October 2000 draft sequence for chromosome 12.
The band location of each clone is indicated by a range on the y-axis. Clones mapping to chromosomes other than 12 are indicated at the bottom. Colours differentiate assignments made in different laboratories. Each clone is anchored on the draft sequence by one or more sequence tags. Plots for the other chromosomes and the 5 September, 2000 assembly can be found at http://genome.ucsc.edu/goldenPath/mapPlots/. Genome browsers that assist researchers in navigating from cytogenetic location to other maps and detailed, annotated sequence information are available at http://www.ncbi.nlm.nih.gov/cgi-bin/Entrez/hum_srch (NCBI Mapviewer, which includes chromosomal aberrations associated with cancer and inherited disorders), http://www.ensembl.org/ and http://genome.ucsc.edu.
Figure 3
Figure 3. Copy-number analysis of myeloblastic leukaemia ML-2 cell line using CGH and a genome-wide array of around 2,000 BAC clones.
The ML-2 cell line has acquired chromosomal abnormalities in addition to those present in the original tumour during long-term culture. CGH maps regions of abnormal copy number by comparing the relative efficiency with which test (Cy3-labelled ML-2 DNA) and reference (Cy5-labelled normal female DNA) hybridize to clones on the array. The array excludes clones that hybridize to multiple sites in the genome. a, Fluorescence ratios of Cy3 to Cy5 fluorescence for each BAC normalized to the median ratio for all 2,000 clones on the array, ordered from 1pter to Xqter. Arrows, chromosomal regions showing significant copy number variations. The lower ratio on the X indicates expected ratio for mismatched sex of test and reference DNAs. Fluorescence ratios of clones on chromosomes 11 (b) and 20 (c) are shown with clones ordered according to position of their STSs on the G3 radiation hybrid or Genethon linkage maps, respectively.

References

    1. The International Human Genome Mapping Consortium A physical map of the human genome. Nature. 2001;409:934–941. doi: 10.1038/35057157. - DOI - PubMed
    1. International Human Genome Sequencing Consortium Initial sequencing and analysis of the human genome. Nature. 2001;409:860–921. doi: 10.1038/35057062. - DOI - PubMed
    1. Caspersson T, et al. Chemical differentiation along metaphase chromosomes. Exp. Cell Res. 1968;49:219–222. doi: 10.1016/0014-4827(68)90538-7. - DOI - PubMed
    1. Trask BJ. Genome Analysis: A Laboratory Manual. 1999. pp. 303–413.
    1. Collins FS. Positional cloning moves from perditional to traditional. Nature Genet. 1995;9:347–350. doi: 10.1038/ng0495-347. - DOI - PubMed

Publication types

Substances