Comparative Study
. 2001 Mar;22(3):431-40.

Experimental MR imaging-guided interstitial cryotherapy of the brain

Affiliations
Comparative Study

Experimental MR imaging-guided interstitial cryotherapy of the brain

J Tacke et al. AJNR Am J Neuroradiol. 2001 Mar.

Abstract

Background and purpose: Hyperthermal ablation techniques such as laser or RF ablation require dedicated heat-sensitive MR imaging sequences for monitoring MR imaging--guided interventions. Because cryotherapy does not have these limitations, the purpose of this study was to evaluate the feasibility of MR imaging--guided percutaneous cryotherapy of the brain.

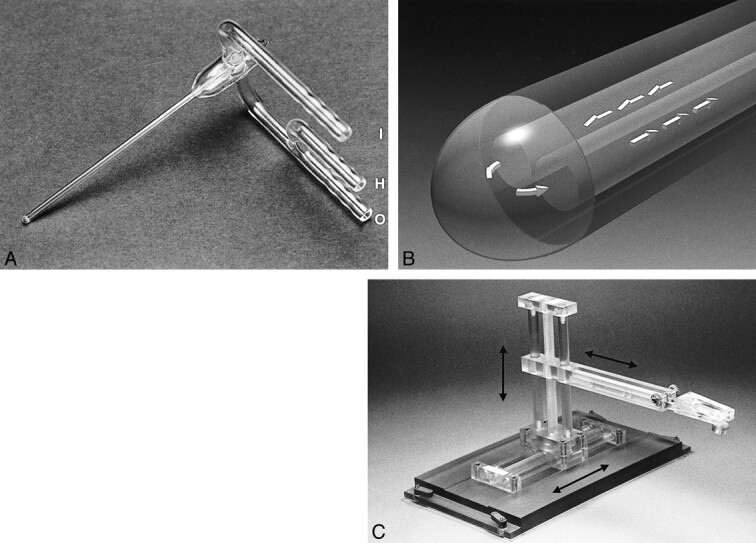
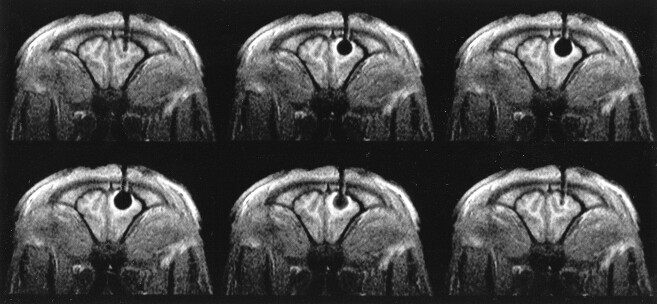
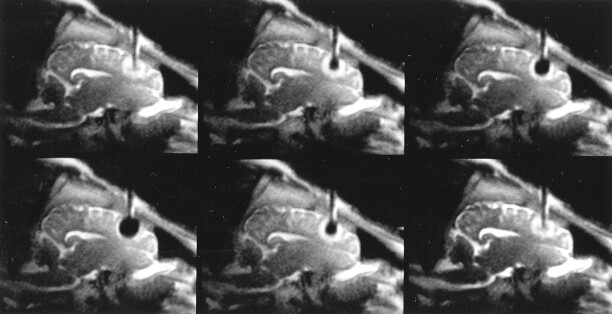
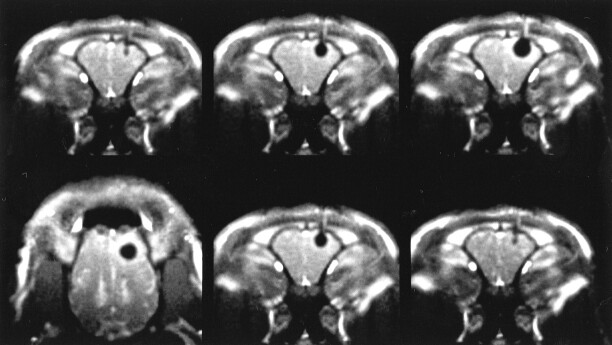
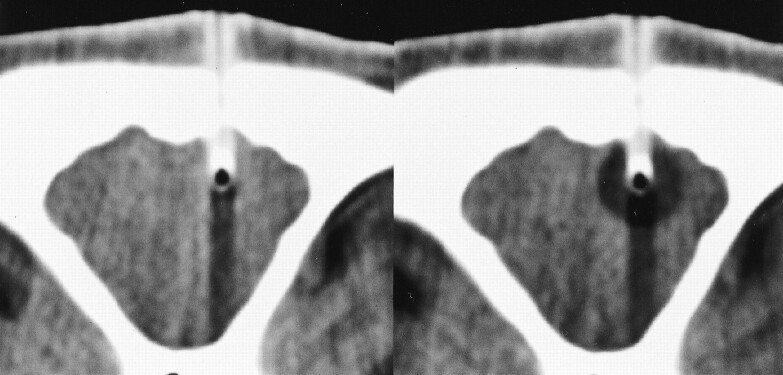
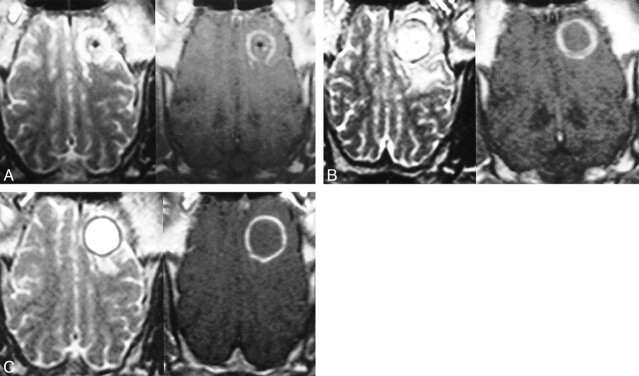
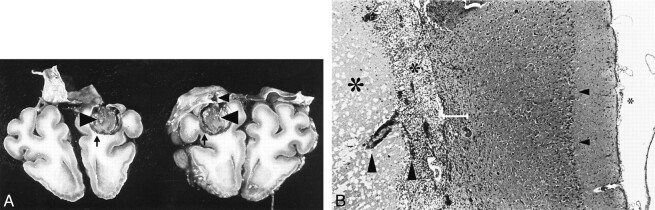
Methods: An experimental cryoprobe with an outer diameter of 2.7 mm was inserted into the right frontal lobe of 11 healthy pigs under MR imaging control. Freezing procedures were monitored by using an interventional 1.5-T magnet and a gradient-echo sequence with radial k-space trajectories, a fast T2-weighted single-shot spin-echo sequence, and a T1-weighted single-shot gradient-echo sequence. In three animals, the procedure was also monitored by using dynamic CT. A freeze-thaw cycle with a duration of 3 minutes was repeated three times per animal. Follow-up MR images were obtained 3, 7, and 14 days after cryotherapy by using conventional MR sequences. Six animals were killed 7 days after intervention, and five animals were killed 14 days after intervention. The brains were sectioned, and the histologic findings of the lesions were compared with the MR imaging appearance.

Results: No artifacts due to the probe were observed on the MR images or CT scans. The ice formation (mean diameter, 12.5 mm) was very well delineated as a signal-free sphere. MR monitoring of the freezing procedure yielded a significantly higher ice:tissue contrast than did CT. The size of the ice ball as imaged by MR imaging and CT during the intervention correlated well with the MR imaging appearance of the lesions at the 14-day follow-up examination and with the histologic findings. Histologically, coagulation necrosis and gliosis were found, surrounded by a transition zone of edema and a disrupted blood-brain barrier, corresponding to a contrast-enhancing rim around the lesions on follow-up MR images.

Conclusion: MR imaging-guided cryotherapy of the brain is possible and allows a precise prediction of the resulting necrosis. MR imaging of the freezing process does not require heat-sensitive sequences and is superior to CT for monitoring of cryoablation.


Figures

<sc>fig</sc> 1.
fig 1.
Study equipment. A, Experimental cryoprobe, cylindrically shaped with an outer diameter of 2.7 mm. Two ports are connected to thermally insulated polytetrafluorethylene tubes (not shown) for supply (inflow, I) and exhaust (outflow, O) of the coolant. A third port allows active heating of the probe by flushing the system with gaseous nitrogen (not used in this study, H). B, Schematic model of the experimental cryotherapy probe (detail). Two inner lumina provide inflow and exhaust of liquid nitrogen (arrows). The active probe tip is thermally not insulated. An outer lumen provides vacuum insulation of the shaft. C, Fixation device. For reasons of MR imaging compatibility, the device was made of polycarbonate. The cryotherapy probe was placed into a plastic handling support with a spherical adapter (not shown). After placement of the probe by hand, the fixation device was moved in three axes (arrows), so that the spherical adapter of the handling support was caught and the fixation device was locked. The ground platter of the fixation device was locked on the MR imaging table before fixation of the probe.
<sc>fig</sc> 2.
fig 2.
Dynamic T1-weighted fast field echo coronal section of the anterior brain, obtained during the first freezing cycle. The imaging duration was 4 seconds. The inactive cryoprobe appears signal free and causes no artifacts (upper row, left). After passing cryogen through the probe (from left to right), a signal-free and spherically shaped ice ball forms around the probe tip. Excellent ice:tissue contrast (91%, mean signal intensity of the ice, 90.7 ± 21.6; mean signal intensity of the unfrozen brain, 1032.5 ± 135.6). Note the hyperintense rim around the signal-free ice, which follows the growing and thawing ice formation and is assumed to represent the temperature gradient of the cooled but unfrozen tissue. Signal increase of the ice is seen during thawing (lower row, middle)
<sc>fig</sc> 3.
fig 3.
Dynamic T2-weighted LoLo sequence, sagittal plane through the right hemisphere, second freezing cycle. The imaging duration was 400 milliseconds. The cryoprobe appears as an artifact-free tubular structure. A spherically shaped zone of edema around the inactive probe tip after an initial freeze-thaw cycle can be seen. The T2-weighted contrast provides good delineation of the CSF. The ice:tissue contrast (81%, mean signal intensity of the ice, 240 ± 21.6; mean signal intensity of the unfrozen brain, 1313.4 ± 275.2) was not as good as that of the T1-weighted fast field echo sequence but was sufficient to distinguish ice from tissue
<sc>fig</sc> 4.
fig 4.
Multiplanar radial fast field echo image, obtained during the third freezing cycle. Fluoroscopic MR imaging with ≤25 images per second was performed. The appearance of the inactive and active probe, including the ice formation, comes close to that of T1-weighted fast field echo, although the spatial resolution is reduced. Excellent ice:tissue contrast (mean signal intensity of the ice, 50.9 ± 21.6; mean signal intensity of the unfrozen brain, 474 ± 107). Interactive change from coronal to axial plane during scanning is shown (bottom row, left). Bright contrast of vasculature, which is orthogonal to the imaging plane (venous sinuses and orbital veins), can be seen. The hyperintense halo around the ice is present but is less well seen than that on T1-weighted fast field echo images
<sc>fig</sc> 5.
fig 5.
Coronal view, 5-mm section thickness, soft-tissue window CT scan. The scan duration was 1 second. The inactive probe (left) was hyperdense, except at the tip (active tip without vacuum insulation) and caused no relevant artifacts. Stripe-shaped artifacts due to the cryotherapy probe and the fixation device can be seen. The ice (right) appears as a spherically shaped, sharply delineated hypodense formation around the probe tip. Although the density of the frozen brain (mean, −23.7 ± 15.6 Hounsfield units) is clearly differentiable from that of the unfrozen brain (mean, 32.5 ± 3.2 Hounsfield units), the ice:tissue contrast is statistically significantly inferior to that of all MR images (58%, P < .001)
<sc>fig</sc> 6.
fig 6.
MR images of the brain obtained immediately and at 3, 7, and 14 days after cryotherapy showed spherically shaped lesions of different sizes and appearances. A, Axial plane T2-weighted turbo spin-echo (left) and contrast-enhanced T1-weighted spin-echo (right) images obtained immediately after the freezing. A spherically shaped ring of edema around an isointense cryolesion is visible (left). On the contrast-enhanced image (right), the disrupted blood-brain barrier in the location of the previous interface of frozen and unfrozen brain tissue is visible. Hemorrhage within the lesion can be seen. An inactive cryoprobe is still left in situ. B, Seven days after therapy, the cryolesion appears inhomogeneously hyperintense, surrounded by an inconstant thin rim of hemosiderin (left). Edema in the adjacent white matter can be seen. Thickening of the zone of the disrupted blood-brain barrier is visible on the contrast-enhanced image (right). C, Fourteen days after cryotherapy, the cryolesion appears homogeneously hyperintense on the T2-weighted image (left). The rim of hemosiderin decreased further in signal intensity and surrounds the lesion entirely. The edema outside the cryolesion disappeared incompletely. After the administration contrast medium (right), the zone of disrupted blood-brain barrier decreased in thickness, enabling a sharp delineation of necrosis and viable brain tissue.
<sc>fig</sc> 7.
fig 7.
Histologic findings. A, Gross view of one brain specimen after formalin fixation and coronal section. The lesion was dissected in the center. The frontal section on the left shows sharply delineated necrosis (large arrowhead) in the right hemisphere and a small rim of extravasated blood (arrow). The directly following parietal specimen on the right was turned over, so the same lesion is now seen on the left. Necrosis (large arrowhead) and rim of extravasated blood (arrow) are identical. Iatrogenic lesion of the dura mater (small arrowhead) is inconspicuous. Note the absence of general brain edema and severe hemorrhage. B, Histologic detail of cryolesion and neighboring cortex. Meninges (small asterisk), cerebral cortex with neuronal layer (small arrowhead), and following subcortical white matter are seen above and are unaffected. Transition zone (bar) next to the lesion consisting of vital, edematously, and spongiously altered tissue. Neurons are damaged selectively, when they are involved. Many capillaries (large arrowheads) were observed sprouting from this area and leading into the outer zone of necrosis. In this outer zone (medium asterisk), numerous leukocytes and macrophages were seen. Neutrophils and lymphocytes were also present, in variable composition. In the center of the necrosis (large asterisk), amorphous necrotic tissue with corresponding paleness of nuclei, cell bodies, and fibers was observed (hematoxylin and eosin; original magnification, ×60).

References

    1. Bernays R, Kollias S, Romanowski BJ. Real-time MR-guided neurosurgical interventions. In: Debatin JF, Adam G, eds. Interventional Magnetic Resonance Imaging. Berlin: Springer 1998;151-155
    1. Anzai Y, Lufkin R, DeSalles A, Hamilton DR, Farahani K, Black KL. Preliminary experience with MR-guided thermal ablation of brain tumors. AJNR Am J Neuroradiol 1995;16:39-48 - PMC - PubMed
    1. Kahn T, Bettag M, Ulrich F, et al. MRI-guided laser-induced interstitial thermotherapy of cerebral neoplasms. J Comput Assist Tomogr 1994;18:519-532 - PubMed
    1. Heimburger RF. Ultrasound augmentation of central nervous system tumor therapy. Indiana Med 1985;78:469-476 - PubMed
    1. Cline HE, Schenck JF, Hynynen K, Watkins RD, Souza SP, Jolesz FA. MR-guided focused ultrasound surgery. J Comput Assist Tomogr 1992;16:956-965 - PubMed

Publication types