Comparative Study
. 2001 Mar;22(3):481-92.

Evaluation of the intracranial dural sinuses with a 3D contrast-enhanced MP-RAGE sequence: prospective comparison with 2D-TOF MR venography and digital subtraction angiography

Affiliations
Comparative Study

Evaluation of the intracranial dural sinuses with a 3D contrast-enhanced MP-RAGE sequence: prospective comparison with 2D-TOF MR venography and digital subtraction angiography

L Liang et al. AJNR Am J Neuroradiol. 2001 Mar.

Abstract

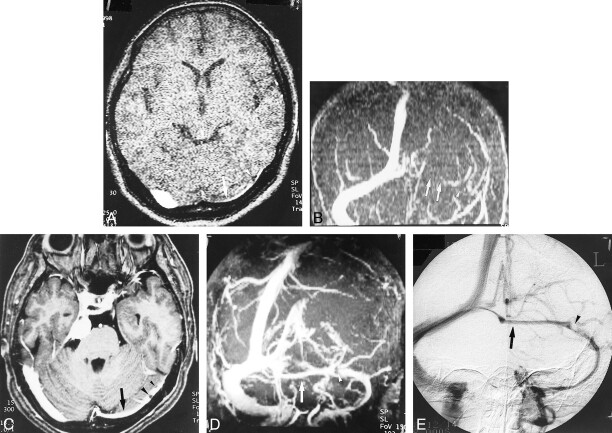
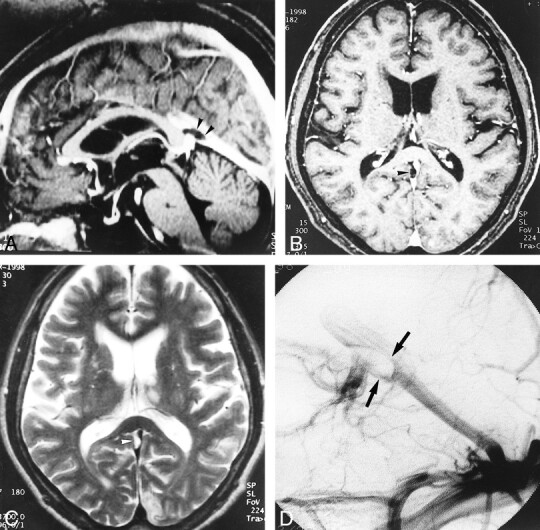
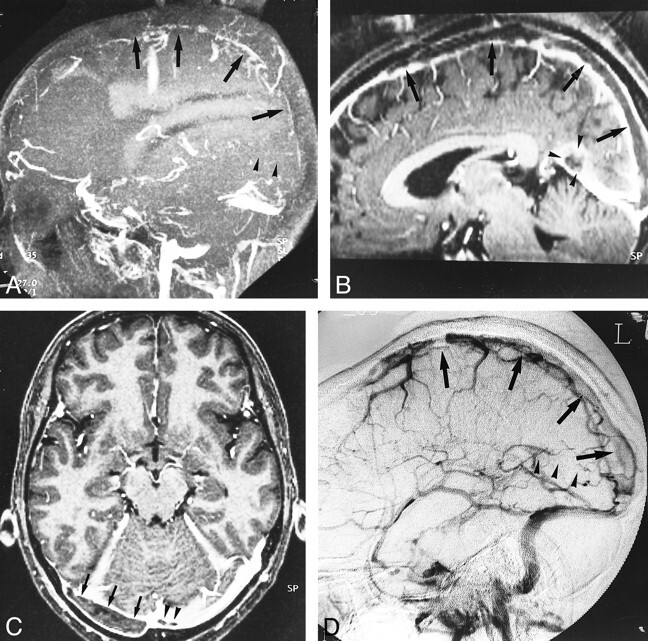
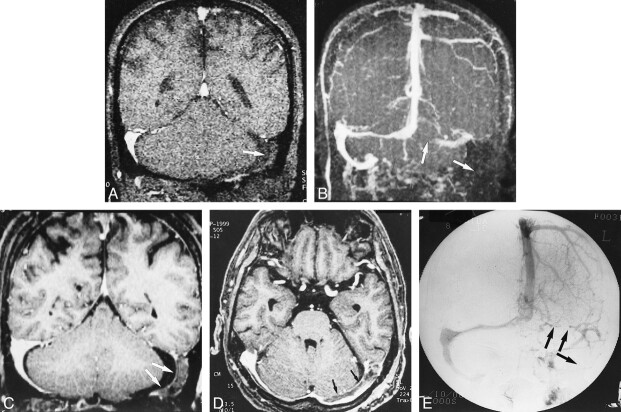
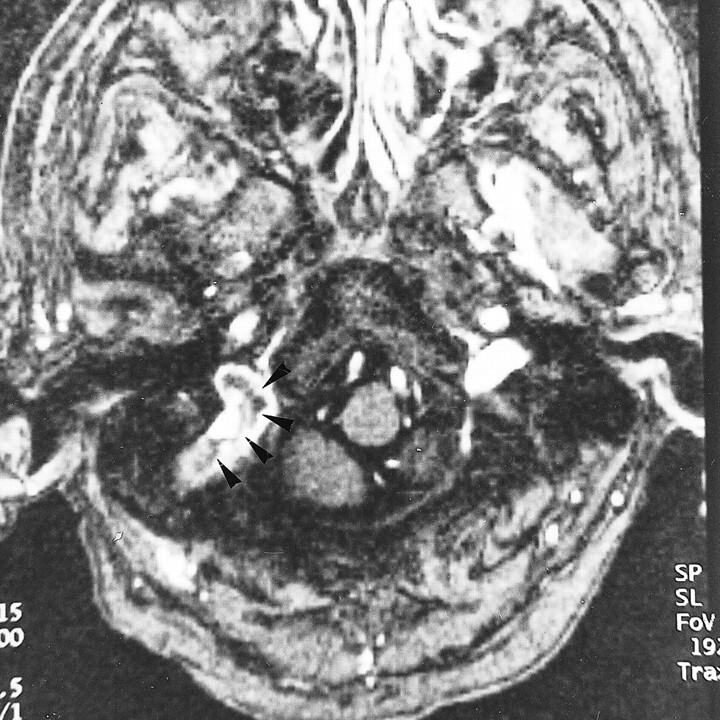
Background and purpose: The diagnosis of dural sinus thrombosis is often difficult because of its variable and nonspecific clinical presentation and the overlapping signal intensities of thrombosis and venous flow on conventional MR images and MR venograms. We compared 3D contrast-enhanced magnetization-prepared rapid gradient-echo (MP-RAGE) sequences with 2D time-of-flight (TOF) MR venography, digital subtraction angiography (DSA), and conventional spin-echo (SE) MR imaging for the assessment of normal and abnormal dural sinuses.

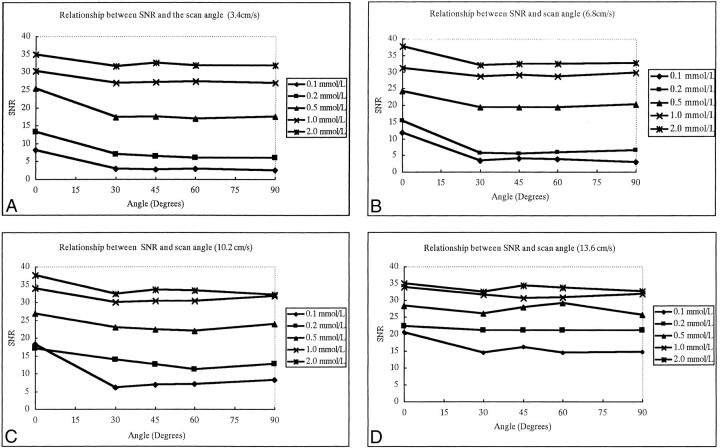
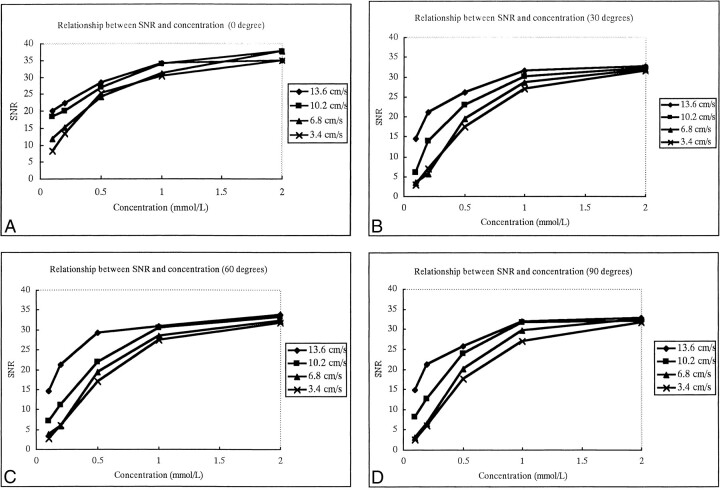
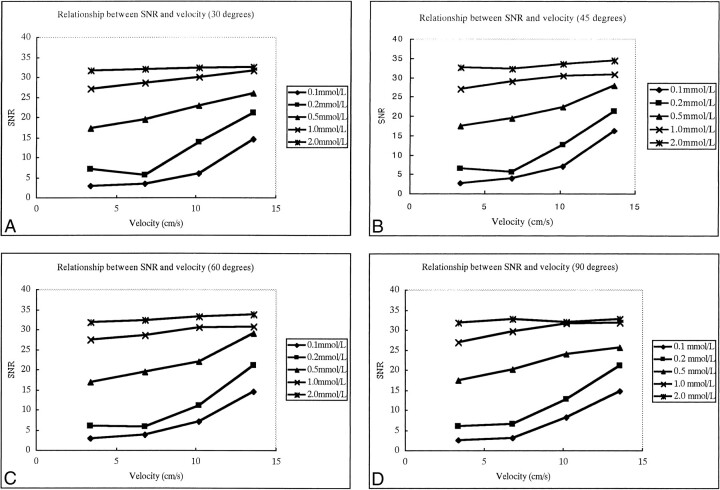
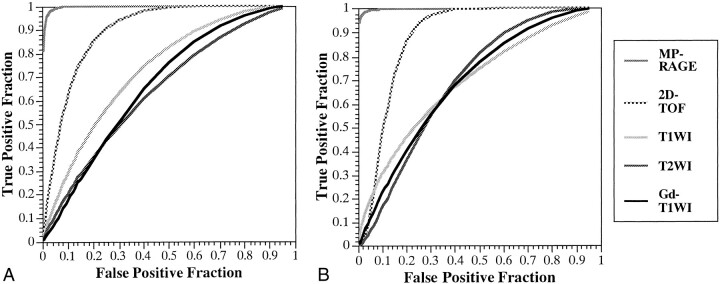
Methods: In a phantom study, a plastic tube with pulsating flow was used to simulate the intracranial dural sinus. With 3D MP-RAGE, a variety of flow velocities, contrast material concentrations, and angulations between the phantom flow tube and the plane of acquisition were tested to measure their relationship to signal-to-noise ratio (SNR). In a clinical study, 35 patients, including 18 with suspected dural sinus thrombosis, were studied with both MR imaging and DSA. Receiver operating characteristic (ROC) analysis was performed in a blinded fashion using DSA as the reference standard.

Results: With the phantom, the SNR of flow increased with increasing contrast concentration, but was not affected by the angle between the tube and scan slab. There was no relationship between SNR and velocity when the contrast concentration was 1.0 mmol/L or greater. In the clinical study, dural sinus thrombosis as well as the normal anatomy of the dural sinuses were seen better with 3D contrast-enhanced MP-RAGE than with 2D-TOF MR venography. Three-dimensional contrast-enhanced MP-RAGE showed the highest diagnostic confidence on ROC curves in the diagnosis of thrombosis.

Conclusion: Three-dimensional contrast-enhanced MP-RAGE is superior to 2D-TOF MR venography and conventional SE MR imaging in the depiction of normal venous structures and the diagnosis of dural sinus thrombosis, and is a potential alternative to DSA.


Figures

<sc>fig</sc> 1.
fig 1.
A–D, The relationship between SNR of flow and the angle between the plastic tube phantom and scan slab plane using four different flow velocities: 3.4 cm/s (A), 6.8 cm/s (B), 10.2 cm/s (C), and 13.6 cm/s (D). The five curves within one graph represent five different concentrations of contrast flow. SNRs are not greatly affected by scan angle
<sc>fig</sc> 2.
fig 2.
A–D, The relationship between SNR of flow and concentration of contrast material using four different scan angles between the plastic tube and the slab: 0° (A), 30° (B), 60° (C), and 90° (D). The four curves within one graph represent four different flow velocities. SNR increases as the contrast material concentration increases, but less dramatically after 1 mmol/L concentration
<sc>fig</sc> 3.
fig 3.
A–D, The relationship between SNR and flow velocity for four different angles: 30° (A), 45° (B), 60° (C), and 90° (D). The five curves within one graph represent five different concentrations of flow of contrast material. SNRs are not greatly affected by fluid velocity if the concentration of flow is greater than 1.0 mmol/L, but SNR does increase significantly with the increase of velocity when flow concentration is low (≤ 0.5 mmol/L)
<sc>fig</sc> 4.
fig 4.
A and B, ROC curves for the two observers (A and B, respectively) when attempting to detect sinus thrombosis on images obtained with 3D contrast-enhanced MR-RAGE (MP-RAGE: 13.5/7/1, TI = 300, flip angle = 15°), 2D-TOF MR venography (2D-TOF: 25/9/1, flip angle = 30°), T1-weighted imaging (T1WI: 600–700/14–24/1), T2-weighted imaging (T2WI: 3700/96/1), and contrast-enhanced T1-weighted imaging (Gd-T1WI: 600–700/14–24/1). The 3D contrast-enhanced MP-RAGE sequence yielded statistically better detection of sinus thrombosis by both observers as compared with 2D-TOF MR imaging (P < .01), T1-weighted imaging, T2-weighted imaging, and contrast-enhanced T1-weighted imaging (P < .01)
<sc>fig</sc> 5.
fig 5.
A–E, Hypoplastic left transverse sinus (arrows) in a patient with a posterior fossa meningioma. Although it is difficult to distinguish hypoplasia from occlusion or thrombosis on the source and MIP images (A and B) of 2D-TOF MR venography (25/9/1, flip angle = 30°), the hypoplastic sinus is clearly depicted on the source and MIP images (C and D) of 3D contrast-enhanced MP-RAGE (13.5/7/1, TI = 300, flip angle = 15°), which are nearly identical to the DSA venogram (E). The pacchionian granulations (arrowheads) are also well delineated on 3D contrast-enhanced MP-RAGE images
<sc>fig</sc> 6.
fig 6.
A–D, Large pacchionian granulation at the top of the straight sinus (arrowheads). Pacchionian granulation is hypointense on reconstructed sagittal and source axial images (A and B) of 3D contrast-enhanced MP-RAGE (13.5/7/1, TI = 300, flip angle = 15°) and hyperintense on T2-weighted image (C) (3700/96/1). DSA image (D) shows filling defect in corresponding region (and could be misdiagnosed as a sinus thrombus)
<sc>fig</sc> 7.
fig 7.
A–D, Diffuse sinus thrombosis (arrows, arrowheads) in a 37-year-old woman with a history of abruption of placenta and diabetes insipidus. The diagnosis of thrombosis may be possible from the sagittal MIP image of 2D-TOF MR venography (25/9/1, flip angle = 30°) (A) and by the indirect finding of lack of visualization of the affected sinuses. With 3D contrast-enhanced MP-RAGE (13.5/7/1, TI = 300, flip angle = 15°), however, the reconstructed sagittal and source axial images (B and C) show the extent and size of the low signal thrombosis (arrows) as well as the patency of the affected sinuses, which is confirmed on DSA image (D)
<sc>fig</sc> 8.
fig 8.
A–E, Postoperative sinus thrombosis (arrows) in a 62-year-old man. The coronal source and MIP images of 2D-TOF MR venography (25/9/1, flip angle = 30°) (A and B) show no flow signals in the left transverse and sigmoid sinuses, which may be difficult to differentiate from hypoplasia of the sinuses (see fig 5). The reconstructed coronal and source axial images (C and D) from a 3D contrast-enhanced MP-RAGE sequence (13.5/7/1, TI = 300, flip angle = 15°) clearly show the thrombosis in the left transverse and sigmoid sinuses, which is confirmed on the DSA image (E)
<sc>fig</sc> 9.
fig 9.
Residual thrombosis after thrombolysis in a 65-year-old woman. Axial source image of 3D contrast-enhanced MP-RAGE sequence (13.5/7/1, TI = 300, flip angle = 15°) shows the partially dissolved, irregular residual thrombosis within the jugular bulb (arrowheads). Abnormalities in the jugular bulb are sometimes missed with 2D-TOF MR venography because of its inconsistent depiction of thrombosis and limited coverage

References

    1. Kim SY, Suh JH. Direct endovascular thrombolytic therapy for dural sinus thrombosis: infusion of alteplase. AJNR Am J Neuroradiol 1997;18:639-645 - PMC - PubMed
    1. Provenzale JM, Joseph GJ, Barboriak DP. Dural sinus thrombosis: findings on CT and MR imaging and diagnostic pitfalls. AJR Am J Roentgenol 1998;170:777-783 - PubMed
    1. Tsai FY, Wang AM, Matovich VB, et al. MR staging of acute dural sinus thrombosis: correlation with venous pressure measurements and implications for treatment and prognosis. AJNR Am J Neuroradiol 1995;16:1021-1029 - PMC - PubMed
    1. Zimmerman RD, Ernst RJ. Neuroimaging of cerebral venous thrombosis. Neuroimaging Clin North Am 1992;2:463-485
    1. Ayanzen RH, Bird CR, Keller PJ, McCully FJ, Theobald MR, Heiserman JE. Cerebral MR venography: normal anatomy and potential diagnostic pitfalls. AJNR Am J Neuroradiol 2000;21:74-78 - PMC - PubMed

Publication types