. 2001 Mar;158(3):1039-51.
doi: 10.1016/S0002-9440(10)64051-5.

Generation of C-reactive protein and complement components in atherosclerotic plaques

Affiliations

Generation of C-reactive protein and complement components in atherosclerotic plaques

K Yasojima et al. Am J Pathol. 2001 Mar.

Abstract

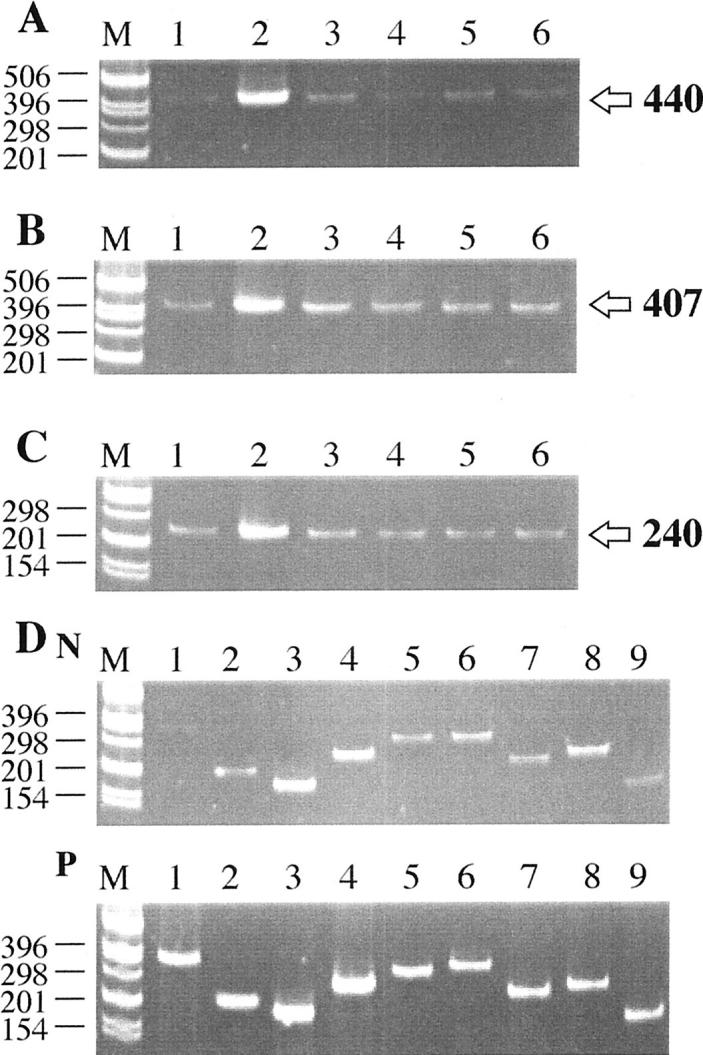
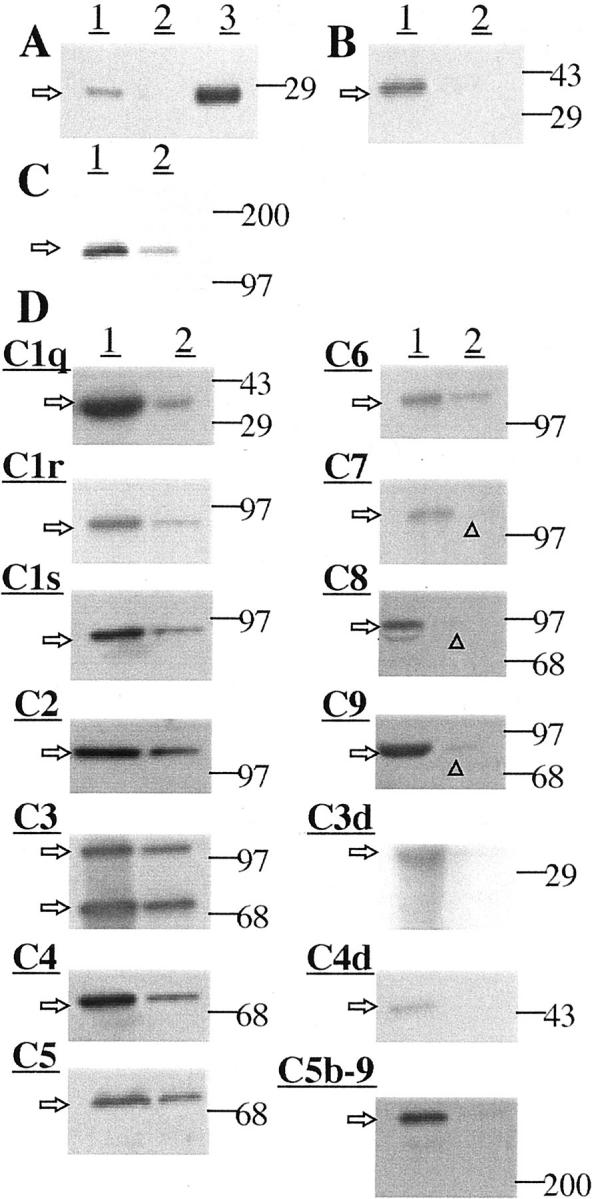
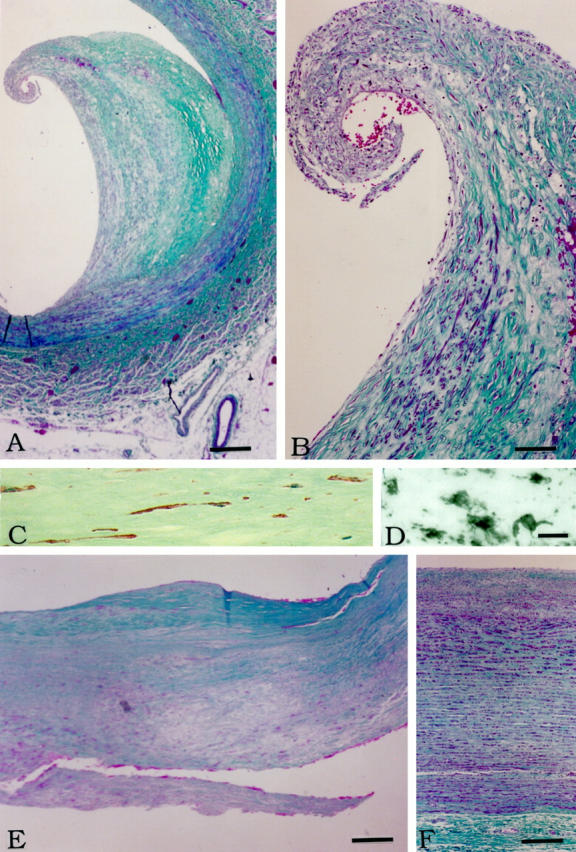
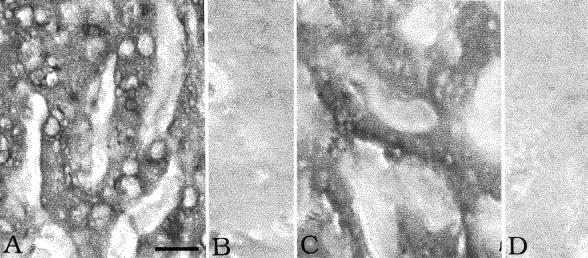
C-reactive protein (CRP) and complement are hypothesized to be major mediators of inflammation in atherosclerotic plaques. We used the reverse transcriptase-polymerase chain reaction technique to detect the mRNAs for CRP and the classical complement components C1 to C9 in both normal arterial and plaque tissue, establishing that they can be endogenously generated by arteries. When the CRP mRNA levels of plaque tissue, normal artery, and liver were compared in the same cases, plaque levels were 10.2-fold higher than normal artery and 7.2-fold higher than liver. By Western blotting, we showed that the protein levels of CRP and complement proteins were also up-regulated in plaque tissue and that there was full activation of the classical complement pathway. By in situ hybridization, we detected intense signals for CRP and C4 mRNAs in smooth muscle-like cells and macrophages in the thickened intima of plaques. By immunohistochemistry we showed co-localization of CRP and the membrane attack complex of complement. We also detected up-regulation in plaque tissue of the mRNAs for the macrophage markers CD11b and HLA-DR, as well as their protein products. We showed by immunohistochemistry macrophage infiltration of plaque tissue. Because CRP is a complement activator, and activated complement attacks cells in plaque tissue, these data provide evidence of a self-sustaining autotoxic mechanism operating within the plaques as a precursor to thrombotic events.


Figures

Figure 1.
Figure 1.
Representative Polaroid photographs showing ethidium bromide-stained gels of RT-PCR products. A: CRP; B: CD11b; C: HLA-DR; D: complement components. In each Polaroid photograph, size markers are in lane M, with the sizes themselves being indicated on the left. Arrows on the right point to the size of PCR products. A, B, and C: Lane 1, normal artery; lane 2, plaque tissue; lane 3, liver; lane 4, heart; lane 5, kidney; lane 6, spleen. Notice in A that faint bands are obtained in all normal tissues, with an extremely intense band being obtained for plaque tissue (lane 2). In B, notice somewhat stronger bands for CD11b in all tissues, again with an intense band for atherosclerotic plaque tissue (lane 2). In C, notice a similar appearance of bands in all normal tissues, again with an intense band for HLA-DR in plaque tissue (lane 2). D: lane 1, C1q (358 bp); lane 2, C2 (215 bp); lane 3, C3 (186 bp); lane 4, C4 (256 bp); lane 5, C5 (315 bp); lane 6, C6 (338 bp); lane 7, C7 (248 bp); lane 8, C8 (258 bp); lane 9, C9 (180 bp). N stands for normal artery (above) and P for plaque tissue (below). Notice that considerably more intense bands are obtained for all of the complement components in plaque tissue compared with normal artery, especially for C1q (lane 1) and C9 (lane 9).
Figure 2.
Figure 2.
Western blot data for protein extracts of various tissues (see Materials and Methods for details). Arrows on the left indicate the size of observed bands; lines on the right point to the positions of size markers used to estimate molecular weights. A: Detection of CRP. Lane 1, plaque extract; lane 2, normal arterial extract; lane 3, 0.5 μg of CRP protein as a standard. Notice a detectable band at ∼ 28 kd in plaque extract. There was no detectable band in normal arterial extract. An intense band was obtained for 0.5 μg of CRP standard. B: Detection of CD11b. Lane 1, atherosclerotic plaque extract; lane 2, normal arterial extract. A strong band was obtained for atherosclerotic plaque extract, at ∼155 kd with no detectable band for normal arterial extract. C: Detection of HLA-DR. Lane 1, atherosclerotic plaque extract; lane 2, normal arterial extract. A strong band of ∼35 kd was obtained in plaque extract, and a weak band for normal arterial extract. D: Detection of complement proteins. In all cases, lane 1 is for atherosclerotic plaque extract and lane 2 for normal arterial extract. Strong bands were obtained for all components in atherosclerotic plaque extracts (C1q, ∼35 kd; C1r, ∼85 kd; C1s, ∼85 kd; C2, ∼110 kd; C3, ∼115, 75 kd; C4, ∼75 kd; C5, ∼75 kd; C6, ∼120 kd; C7, ∼115 kd; C8, ∼85 kd; C9, ∼80 kd). Also detected were bands for the activated complement fragments C3d, ∼35 kd; C4d, ∼45 kd; and C5b-9. Weaker bands were obtained for normal arterial tissue, except for the activated components C3d, C4d, and C5b-9. The very faint bands are indicated by arrowheads.
Figure 3.
Figure 3.
Histochemistry and immunohistochemistry of plaque and normal arterial tissue. A: Low-power photomicrograph of a mature plaque stained by the Gomori trichrome method. The lumen is to the left. Notice how the swollen intima has peeled from the media starting near the shoulder region. Muscle stains deep red. Collagen fibers stain green. Endothelial cells and macrophages stain red. B: Higher power photomicrograph of the peeled region shown in A. Elongated cells of smooth muscle origin are abundant in the fibrous cap. Many round cells also appear in the hypertrophied tissue. C: High-power photomicrograph of the intimal region shown in B immunostained for caldesmon (red color), a marker for smooth muscle cells (see Material and Methods for details). Notice the elongated cell morphology. The section is weakly counterstained with hematoxylin to display nuclei (light blue color). D: High-power photomicrograph of the same region as in C immunostained for HLA-DR to reveal macrophages (see Materials and Methods for details). Notice the differing morphology of the cells. They are round or ovoid, sometimes with short thick processes. E: Low-power photomicrograph of the intima of carotid plaque tissue removed at endarterectomy stained by the Gomori trichrome method. The lumen is toward the top. Notice the fibrous cap (green) over an acellular lipid region. F: Gomori stain of normal aorta. The lumen is toward the top. Scale bars: 500 μm (A), 50 μm (B), 25 μm (C and D), 250 μm (E), 100 μm (F).
Figure 4.
Figure 4.
In situ hybridization for CRP and C4 mRNAs. A: Medium-power photomicrograph of the area shown in Figure 3B ▶ hybridized with the CRP antisense probe. Many cells are positive. B: Low-power photomicrograph of the area shown in Figure 3A ▶ hybridized with the CRP sense probe. No signal is seen. C: High-power photomicrograph of hybridization with the CRP antisense probe showing positive cells with both myocyte-like and macrophage morphology. Compare the morphology with Figure 3, C and D ▶ . D: Medium-power photomicrograph of the area shown in Figure 3B ▶ hybridized with the C4 antisense probe. Many cells are positive. E: Low-power photomicrograph of the area shown in Figure 3A ▶ hybridized with the C4 sense probe. No signal is seen. F: High-power photomicrograph of hybridization with the C4 antisense probe showing positive cells with myocyte-like and macrophage morphology. G: In situ hybridization with CRP antisense probe in normal aorta (same area as Figure 3F ▶ ). Only faint signals are detected. H: In situ hybridization of the same area of normal aorta with the CRP sense probe. No signal is seen. I: In situ hybridization of the same area of normal aorta with the C4 antisense probe. Only faint signals are detected. J: In situ hybridization of the same area of normal aorta with the sense C4 probe. No signal is seen. Scale bars: D (for A and D), 100 μm; E (for B and E), 250 μm; F (for C and F), 25 μm; J (for G–J), 100 μm.
Figure 5.
Figure 5.
Comparison of in situ hybridization and immunohistochemistry. A: In situ hybridization with the CRP antisense probe of endarterectomized carotid artery. The area is the same as in Figure 3E ▶ . Notice the intense but patchy hybridization, especially of elongated myocyte-like cells in the fibrous cap area and near the edges of the acellular lipid deposit. B: In situ hybridization of the same area with the C4 antisense probe. Similar hybridization is seen. C: Same area immunostained for sC5b-9. Many elongated cells are immunostained indicating that complement has been fully activated, with the MAC associating with myocyte-like cells in the area generating CRP and C4 mRNAs. D: Higher power photomicrograph of the same area immunostained for CRP. Positive cells with both elongated and round morphology are seen. E: Same area immunostained for sC5b-9. Cells of elongated morphology are primarily immunostained, indicating activation of the complement pathway in the same areas generating CRP protein. Scale bars, C (for A–C), 250 μm; E (for D and E), 100 μm.
Figure 6.
Figure 6.
In situ hybridization in liver. A: CRP antisense probe. B: CRP sense probe. C: C4 antisense probe. D: C4 sense probe. Notice the hybridization signal over hepatocytes with both antisense probes but no signal with the sense probes. Same magnification in each photomicrograph. Scale bar, 30 μm (A).

References

    1. Ross R: Atherosclerosis: an inflammatory disease. N Engl J Med 1999, 340:115-126 - PubMed
    1. Constantinides P: General Pathobiology. 1994:pp 59-116 Appleton & Lange, Norwalk
    1. Seifert PS, Kazatchkine MD: The complement system in atherosclerosis. Atherosclerosis 1988, 73:91-104 - PubMed
    1. Torzewski J, Bowyer DE, Waltenberger J, Fitzsimmons C: Processes in atherogenesis: complement activation. Atherosclerosis 1997, 132:131-138 - PubMed
    1. Libby P, Egan D, Skarkatos S: Roles of infectious agents in atherosclerosis and restenosis: an assessment of the evidence and need for future research. Circulation 1997, 96:4095-4103 - PubMed

Publication types

MeSH terms