Comparative Study
. 2001 Mar;8(2):303-13.
doi: 10.1128/CDLI.8.2.303-313.2001.

Three-color flow cytometry detection of intracellular cytokines in peripheral blood mononuclear cells: comparative analysis of phorbol myristate acetate-ionomycin and phytohemagglutinin stimulation

Affiliations
Comparative Study

Three-color flow cytometry detection of intracellular cytokines in peripheral blood mononuclear cells: comparative analysis of phorbol myristate acetate-ionomycin and phytohemagglutinin stimulation

J Baran et al. Clin Diagn Lab Immunol. 2001 Mar.

Abstract

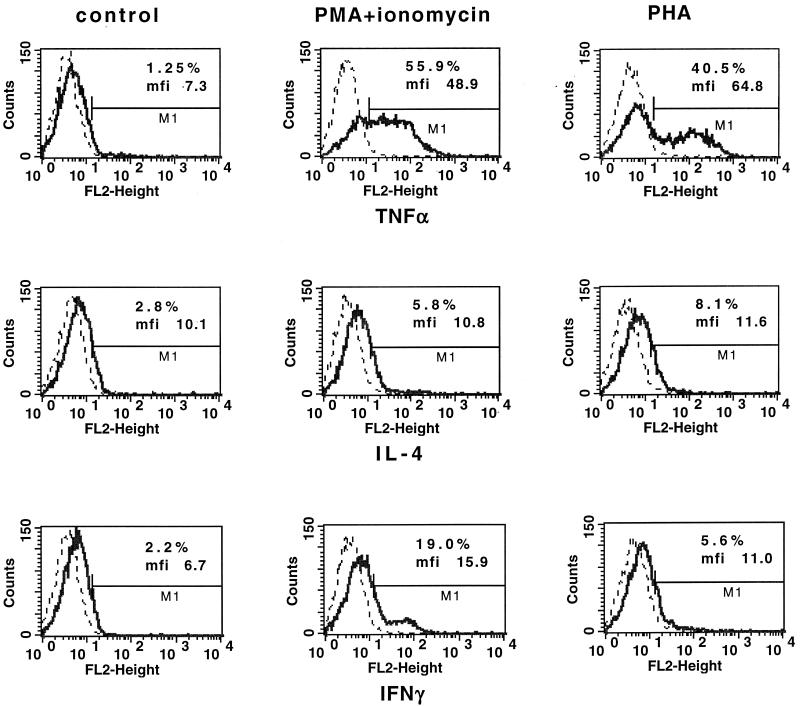
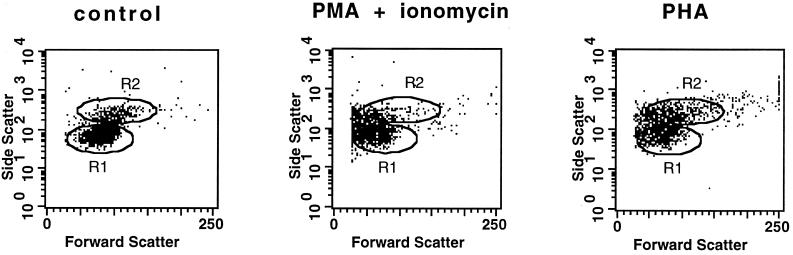
The assessment of intracellular cytokines at the single-cell level by flow cytometry has recently become a potent tool in many areas of cell biology and in defining the role of cytokines in various human diseases. Three-color flow cytometry for detection of intracellular cytokines combined with simultaneous determination of lymphocytes (CD3(+) and CD4(+)) or monocytes (CD33(+) and CD14(+)) was used for comparison of phytohemagglutinin (PHA)-and phorbol myristate acetate (PMA)-ionomycin-induced production of intracellular cytokines in peripheral blood mononuclear cells (PBMCs) of healthy donors. We found that the number of PBMCs stained for tumor necrosis factor alpha and gamma interferon after 6 h of activation was higher when PMA-ionomycin was used for stimulation, while the frequencies of cells positive for interleukin 4 (IL-4) were similar for both stimulators. However, PMA-ionomycin stimulation caused prominent alterations of cell morphology and membrane expression of CD4 and CD14. In contrast, PHA did not cause downregulation of surface markers and resulted in less pronounced alterations in both forward and side scatter signals during flow cytometry analysis. Moreover, during 48 h of culture PHA stimulated tumor necrosis factor beta and IL-10 production, which was not observed when PMA-ionomycin was used. We conclude that the use of PHA for cell activation may limit in vitro artifacts and allow more precise analysis of intracellular cytokine production in various disease states.


Figures

FIG. 1
FIG. 1
Flow cytometry analysis of intracellular cytokine expression in control PBMC (left set of panels) and following either PMA-ionomycin activation (middle set of panels) or PHA activation (right set of panels). PBMCs were cultured in medium alone or were stimulated with PMA-ionomycin or PHA in the presence of monensin for 6 h and stained with PE-labeled anti-cytokine MAbs. Histogram overlays show the FL2 (orange fluorescence) intensity corresponding to a given cytokine (solid line) compared to the intensity for the isotype-specific control (dotted line). The numbers indicate the percentages of positive cells and the mean fluorescence intensity (mfi). The results from one representative experiment of five experiments performed are shown.
FIG. 2
FIG. 2
Alterations of cell size (FSC) and cell granularity (SSC) of PBMCs after activation with PMA-ionomycin or PHA. PBMCs were cultured for 6 h in the medium (left) or were stimulated with PMA-ionomycin (middle) or PHA (right) in the presence of monensin. Dot plots (FSC versus SSC) show the changes in cellular morphology after cell activation. Regions R1 and R2, defined in a control, correspond to lymphocytes and monocytes, respectively.
FIG. 3
FIG. 3
Surface CD4 and CD14 and intracellular TNF-α expression in PBMCs. PBMCs were cultured for 6 h in medium (left panels) or were stimulated with PMA-ionomycin (middle panels) or PHA (right panels) in the presence of monensin. Dot plots of CD4-FITC (FL1 [green fluorescence]) (A) or CD14-FITC (B) versus TNF-α–PE (FL2 [orange fluorescence]) expression in the whole PBMC population are shown. Numbers show percentages of positive cells. Data from one representative experiment of three experiments performed are shown.
FIG. 4
FIG. 4
Intracellular cytokine expression in gated CD3+ T cells by three-color flow cytometry. PBMCs cultured for 6 h in medium (left set of panels) or stimulated with PMA-ionomycin (middle set of panels) or PHA (right set of panels) in the presence of monensin were labeled for the surface expression of CD3 (PE/Cy5) and CD4 (FITC) and for the intracellular presence of different cytokines (PE). Dot plots of CD4-FITC (FL1 [green fluorescence]) versus relevant cytokine-PE (FL2 [orange fluorescence]) after T-cell gating according to CD3-PE/Cy5 (FL3 [red fluorescence]) expression are shown. Numbers show the percentages of CD4 and CD4+ T cells producing cytokines set according to the isotype-matched control. Data from one representative experiment of five experiments performed are shown.
FIG. 5
FIG. 5
Intracellular TNF-α and IL-4 expression in gated CD33+ monocytes by three-color flow cytometry. PBMCs cultured for 6 h in medium (left set of panels) or stimulated with PMA-ionomycin (middle set of panels) or PHA (right set of panels) in the presence of monensin were labeled for surface expression of CD33 (PE/Cy5) and CD14 (FITC) and for intracellular TNF-α or IL-4 by using PE-conjugated MAbs. CD33+ gated monocytes were analyzed on FL1 (FITC) versus FL2 (PE) dot plots to discriminate cytokine expression in CD14 and CD14+ monocytes. Data from one representative experiment of five experiments performed are shown.
FIG. 6
FIG. 6
Quantification of TNF-β- and IL-10-producing CD3+ cells by flow cytometry. PBMCs cultured for 48 h in the medium (left set of panels under “control”) or stimulated with PMA-ionomycin (middle set of panels) or PHA (right set of panels) in the presence of monensin were labeled for surface CD3 (PE/Cy5) and intracellular TNF-β or IL-10 (PE) expression. Cells were gated according to CD3 expression and SSC (region R1). Histogram overlays show FL2 (orange fluorescence) intensity corresponding to a given cytokine (solid line) compared to the intensity for the isotype-specific control (dotted line).
FIG. 7
FIG. 7
Flow cytometry analysis of TNF-β- and IL-10-producing CD33+ cells. PBMCs cultured for 48 h in medium (left set of panels under “control”) or stimulated with PMA-ionomycin (middle set of panels) or PHA (right set of panels) in the presence of monensin were labeled for surface CD33 (PE/Cy5) and intracellular TNF-β or IL-10. Cells were gated according to CD33 expression and SSC (region R1). Histogram overlays show FL2 (orange fluorescence) intensity corresponding to a given cytokine (solid line) compared to the intensity for the isotype-specific control (dotted line). Results from one representative experiment of five experiments performed are shown.

Similar articles

Cited by

References

    1. Andersson J, Abrams J, Bjork L, Litton M, Agren K, Andersson U. Concomitant in vivo production of 19 different cytokines in human tonsils. Immunology. 1994;83:16–24. - PMC - PubMed
    1. Assenmacher M, Schmitz J, Radbruch A. Flow cytometric determination of cytokines in activated murine T helper lymphocytes: expression of interleukin-10 in interferon-gamma and inteleukin-4-expressing cells. Eur J Immunol. 1994;24:1097–1101. - PubMed
    1. Bjork L, Fehninger T E, Andersson U, Andersson J. Computerized assessment of production of multiple human cytokines at the single-cell level using image analysis. J Leukoc Biol. 1996;59:287–295. - PubMed
    1. Carter L L, Swain S L. Single cell analysis of cytokine production. Curr Opin Immunol. 1997;9:177–182. - PubMed
    1. Fernandez V, Andersson J, Andersson U, Troye-Blomberg M. Cytokine synthesis analyzed at the single-cell level before and after revaccination with tetanus toxoid. Eur J Immunol. 1994;24:1808–1815. - PubMed

Publication types

MeSH terms