. 2001 Mar 5;193(5):551-62.
doi: 10.1084/jem.193.5.551.

Identification of a crucial energetic footprint on the alpha1 helix of human histocompatibility leukocyte antigen (HLA)-A2 that provides functional interactions for recognition by tax peptide/HLA-A2-specific T cell receptors

Affiliations

Identification of a crucial energetic footprint on the alpha1 helix of human histocompatibility leukocyte antigen (HLA)-A2 that provides functional interactions for recognition by tax peptide/HLA-A2-specific T cell receptors

B M Baker et al. J Exp Med. .

Abstract

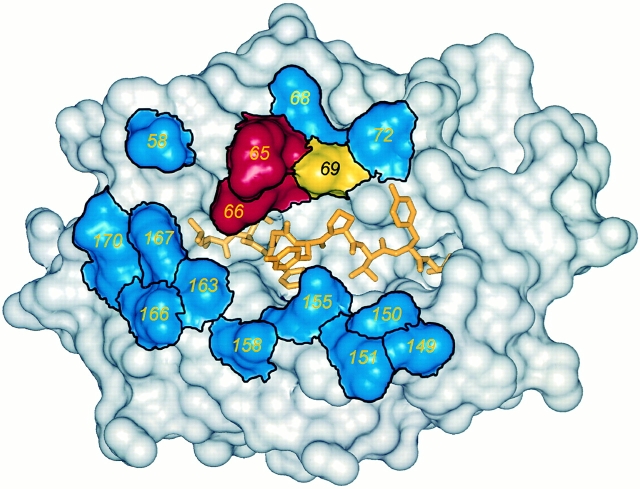
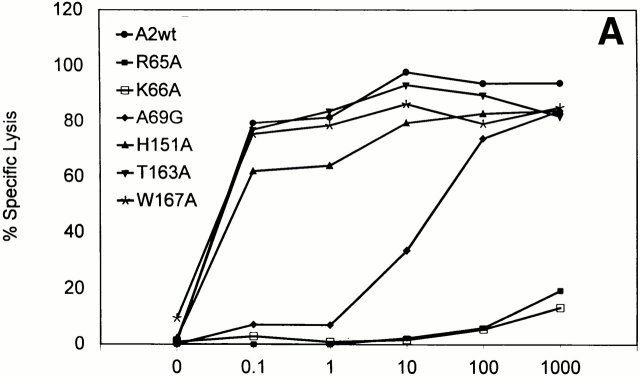
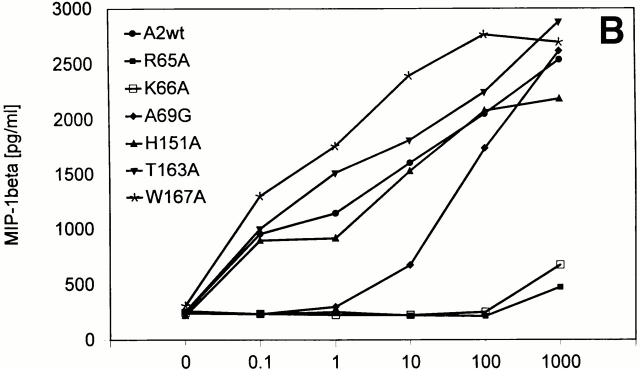
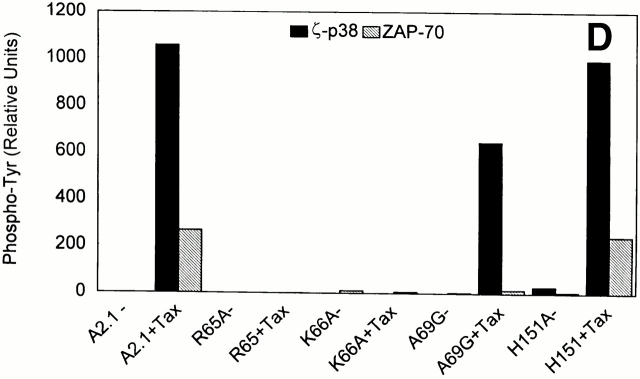
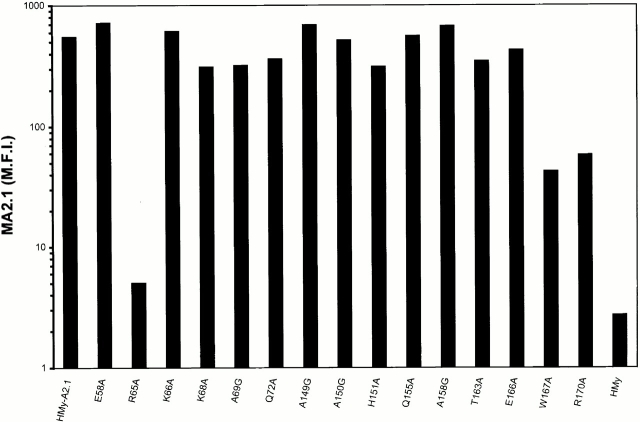
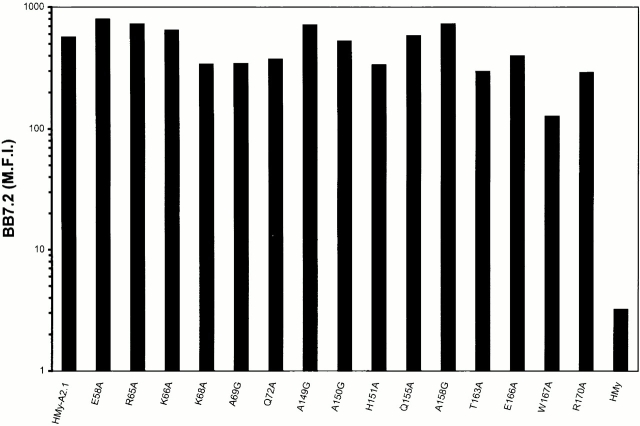
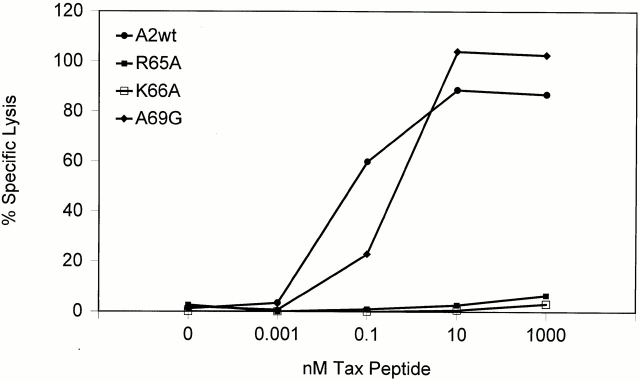
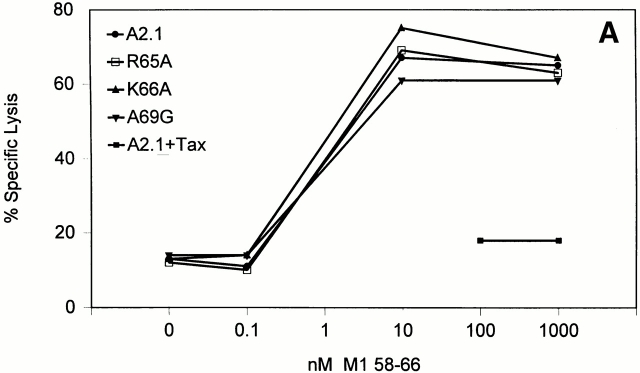
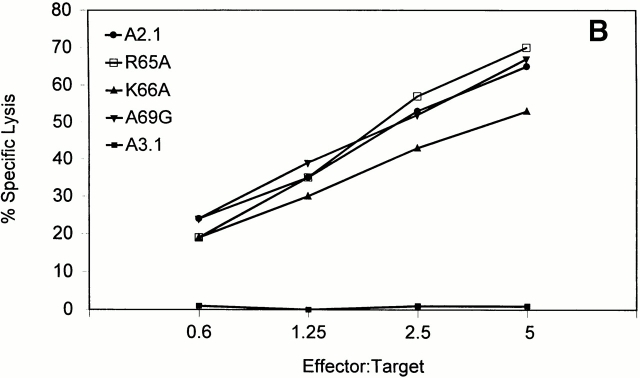
Structural studies have shown that class I major histocompatibility complex (MHC)-restricted peptide-specific T cell receptor (TCR)-alpha/betas make multiple contacts with the alpha1 and alpha2 helices of the MHC, but it is unclear which or how many of these interactions contribute to functional binding. We have addressed this question by performing single amino acid mutagenesis of the 15 TCR contact sites on the human histocompatibility leukocyte antigen (HLA)-A2 molecule recognized by the A6 TCR specific for the Tax peptide presented by HLA-A2. The results demonstrate that mutagenesis of only three amino acids (R65, K66, and A69) that are clustered on the alpha1 helix affected T cell recognition of the Tax/HLA-A2 complex. At least one of these three mutants affected T cell recognition by every member of a large panel of Tax/HLA-A2-specific T cell lines. Biacore measurements showed that these three HLA-A2 mutations also altered A6 TCR binding kinetics, reducing binding affinity. These results show that for Tax/HLA-A2-specific TCRs, there is a location on the central portion of the alpha1 helix that provides interactions crucial to their function with the MHC molecule.


Figures

Figure 1
Figure 1
Mutated HLA-A2 amino acids mapped on the surface of the molecule. Coloring indicates the effects of each mutation upon function. Blue, no effect; red, strong effect; yellow, intermediate effect. See Table for details. Image generated with InsightII (MSI Inc.).
Figure 3
Figure 3
Presentation of the Tax peptide by wild-type and mutant HLA-A2–transfected cells to A6 TCR-bearing clones. Clone 2G4 was assayed for the capacity to recognize Tax peptide-pulsed antigen-presenting cells by (A) direct lysis (E/T ± 2.5:1), (B) MIP-1β secretion, and (C) IFN-γ secretion. (D) A6 TCR-mediated signal transduction was quantitated by phosphorylation of the p38 form of phospho-ζ-chains and phosphorylation of ZAP-70 from clone RS56 stimulated with the indicated unpulsed (−) or Tax peptide-pulsed antigen-presenting cells. In A, additional titrations of 0.01 and 0.001 mM peptide for Tax, H151A, and T163A were indistinguishable, but were not shown because of x-axis compression.
Figure 3
Figure 3
Presentation of the Tax peptide by wild-type and mutant HLA-A2–transfected cells to A6 TCR-bearing clones. Clone 2G4 was assayed for the capacity to recognize Tax peptide-pulsed antigen-presenting cells by (A) direct lysis (E/T ± 2.5:1), (B) MIP-1β secretion, and (C) IFN-γ secretion. (D) A6 TCR-mediated signal transduction was quantitated by phosphorylation of the p38 form of phospho-ζ-chains and phosphorylation of ZAP-70 from clone RS56 stimulated with the indicated unpulsed (−) or Tax peptide-pulsed antigen-presenting cells. In A, additional titrations of 0.01 and 0.001 mM peptide for Tax, H151A, and T163A were indistinguishable, but were not shown because of x-axis compression.
Figure 2
Figure 2
Levels of cell surface expression of wild-type and mutant HLA-A2 molecules. Hmy2.C1R cells were transfected with the indicated mutant HLA-A2 constructs and levels of cell surface expression measured by cytofluorometry using two different anti-A2 antibodies MA2.1 (top) and BB7.2 (bottom). Untransfected cells served as a negative control (Hmy). Y-axes are mean fluorescence intensity (M.F.I.).
Figure 2
Figure 2
Levels of cell surface expression of wild-type and mutant HLA-A2 molecules. Hmy2.C1R cells were transfected with the indicated mutant HLA-A2 constructs and levels of cell surface expression measured by cytofluorometry using two different anti-A2 antibodies MA2.1 (top) and BB7.2 (bottom). Untransfected cells served as a negative control (Hmy). Y-axes are mean fluorescence intensity (M.F.I.).
Figure 4
Figure 4
Representative Biacore binding data. (A) Full kinetic dataset for the Tax/HLA-A2 E166A mutant binding immobilized A6 TCR. Red lines represent fits to a 1:1 binding model; injected concentrations are indicated. Residuals are indicated below the data. Inset: separate equilibrium binding experiment for E166A. (B) Representative kinetic traces for wild-type Tax/HLA-A2, the K66A mutant, and the R65A mutant binding to the A6 TCR. The slow dissociation rates for K66A and R65A are apparent. Data are plotted as every fourth data point along with fits to 1:1 binding models. Plots represent one trace from full datasets as in A. Injected TCR concentrations are indicated. RU, reasonable units.
Figure 5
Figure 5
Recognition of Tax/HLA-A2 transfectants by B7-TCR clone 10B7 as measured by cytotoxicity. E/T = 2.5:1.
Figure 6
Figure 6
Recognition of HLA-A2 molecules by T cells specific for influenza M1 peptide M1 58–66 and HLA-A2 allospecific T cells. (A) Recognition of M1 peptide-pulsed antigen-presenting cells was assayed by lysis of the M1 peptide-specific CTL line 1E8 at E/T = 5:1. (B) Recognition of unpulsed antigen-presenting cells by the HLA-A2 allospecific T cell line 1C1 at the indicated E/T ratios.
Figure 6
Figure 6
Recognition of HLA-A2 molecules by T cells specific for influenza M1 peptide M1 58–66 and HLA-A2 allospecific T cells. (A) Recognition of M1 peptide-pulsed antigen-presenting cells was assayed by lysis of the M1 peptide-specific CTL line 1E8 at E/T = 5:1. (B) Recognition of unpulsed antigen-presenting cells by the HLA-A2 allospecific T cell line 1C1 at the indicated E/T ratios.
Figure 7
Figure 7
Temperature stability of the wild-type, R65A, K66A, and A69G HLA-A2 molecules with the Tax peptide as measured by CD spectroscopy at 218 nm. The apparent T m, measured by the inflection point of the fitted curve, is indicated on each plot. Values on the y-axis indicate normalized CD signal.

Similar articles

Cited by

References

    1. Garcia K., Degano M., Stanfield R., Brunmark A., Jackson M., Peterson P., Teyton L., Wilson I. An αβ T cell receptor structure at 2.5 Å and its orientation in the TCR-MHC complex. Science. 1996;274:209–219. - PubMed
    1. Garboczi D., Ghosh P., Utz U., Fan Q., Biddison W., Wiley D.C. Structure of the complex between human T-cell receptor, viral peptide and HLA-A2. Nature. 1996;384:134–141. - PubMed
    1. Garcia K., Degano M., Pease L., Huang M., Peterson P., Teyton L., Wilson I. Structural basis of plasticity in T cell receptor recognition of a self peptide-MHC antigen. Science. 1998;279:1166–1172. - PubMed
    1. Ding Y.-H., Smith K., Garboczi D., Utz U., Biddison W., Wiley D.C. Two human T cell receptors bind in a similar diagonal mode to the HLA- A2/Tax peptide complex using different TCR amino acids. Immunity. 1998;8:403–411. - PubMed
    1. Ding Y.-H., Baker B.M., Garboczi D., Biddison W., Wiley D.C. Four A6-TCR/peptide/HLA-A2 structures that generate very different T cell signals are nearly identical. Immunity. 1999;11:45–56. - PubMed

Publication types

MeSH terms