. 2001 Mar 5;193(5):573-84.
doi: 10.1084/jem.193.5.573.

Aberrant in vivo T helper type 2 cell response and impaired eosinophil recruitment in CC chemokine receptor 8 knockout mice

Affiliations

Aberrant in vivo T helper type 2 cell response and impaired eosinophil recruitment in CC chemokine receptor 8 knockout mice

S W Chensue et al. J Exp Med. .

Abstract

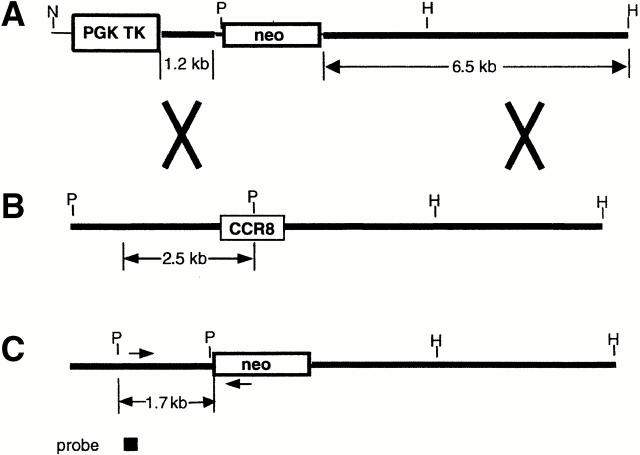
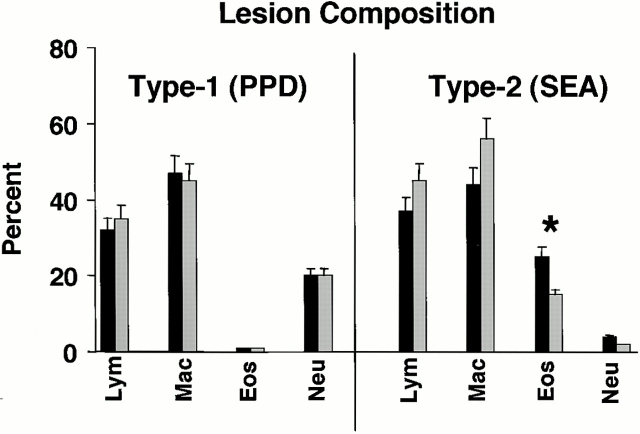
Chemokine receptors transduce signals important for the function and trafficking of leukocytes. Recently, it has been shown that CC chemokine receptor (CCR)8 is selectively expressed by Th2 subsets, but its functional relevance is unclear. To address the biological role of CCR8, we generated CCR8 deficient (-/-) mice. Here we report defective T helper type 2 (Th2) immune responses in vivo in CCR8(-/)- mice in models of Schistosoma mansoni soluble egg antigen (SEA)-induced granuloma formation as well as ovalbumin (OVA)- and cockroach antigen (CRA)-induced allergic airway inflammation. In these mice, the response to SEA, OVA, and CRA showed impaired Th2 cytokine production that was associated with aberrant type 2 inflammation displaying a 50 to 80% reduction in eosinophils. In contrast, a prototypical Th1 immune response, elicited by Mycobacteria bovis purified protein derivative (PPD) was unaffected by CCR8 deficiency. Mechanistic analyses indicated that Th2 cells developed normally and that the reduction in eosinophil recruitment was likely due to systemic reduction in interleukin 5. These results indicate an important role for CCR8 in Th2 functional responses in vivo.


Figures

Figure 1
Figure 1
Generation of CCR8 knockout mice. (A) CCR8 targeting vector; (B) CCR8 genomic locus; (C) predicted recombined CCR8 locus; and (D) RT-PCR demonstration of disrupted CCR8 transcription in CCR8−/− mice. Messenger RNA was isolated from lungs of five mice with type 2 SEA granuloma formation and subjected to semiquantitative RT-PCR. No CCR8 mRNA was detected in knockout mice. *P < 0.05 comparing CCR8+/+ to CCR8−/−.
Figure 1
Figure 1
Generation of CCR8 knockout mice. (A) CCR8 targeting vector; (B) CCR8 genomic locus; (C) predicted recombined CCR8 locus; and (D) RT-PCR demonstration of disrupted CCR8 transcription in CCR8−/− mice. Messenger RNA was isolated from lungs of five mice with type 2 SEA granuloma formation and subjected to semiquantitative RT-PCR. No CCR8 mRNA was detected in knockout mice. *P < 0.05 comparing CCR8+/+ to CCR8−/−.
Figure 3
Figure 3
Effect of CCR8 deletion on cytokine mRNA and protein levels in lungs with secondary type 1 (PPD) and type 2 (SEA) granuloma formation. Lung granulomas were induced in CCR8+/+(129 × B6) and CCR8−/−(129 × B6), as described in Materials and Methods, then on day 4 upper and lower right lung lobes were snap frozen for parallel mRNA and protein analysis. Relative transcript levels were measured by RT-PCR-ELISA. Cytokine levels were determined by ELISA in aqueous extracts then normalized to total protein. Lungs of untreated mice served as baseline controls. Untreated CCR8+/+ and CCR8−/− controls were statistically equivalent. CCR8+/+ (black bars); CCR8−/− (shaded bars); untreated mice (white bars). (A and B) Cytokine mRNA ratios of type 1 and type 2 lungs, respectively; (C and D) corresponding cytokine protein levels. Values are means ± SEM derived from the lungs of five to six mice. *P < 0.05 comparing CCR8+/+ to CCR8−/− lungs by ANOVA. Findings were similar in separate studies using either 129sv or 129sv × C57BL/6 F2 background mice.
Figure 2
Figure 2
Effect of CCR8 deletion on secondary type 1 (PPD) and type 2 (SEA) granuloma formation. Groups of CCR8+/+ (129 × B6) and CCR8−/− (129 × B6) mice were sensitized subcutaneously with M. bovis PPD in Freund's adjuvant or intraperitoneally with 3,000 S. mansoni eggs. After 14 d of sensitization, lung granulomas were elicited with 6,000 PPD or SEA Ag-coated beads. Granulomas were examined on day 4 after bead challenge. (Top left) Type 1 and type 2 granuloma cross-sectional areas. (Top right) Cellular composition of type 1 and type 2 lung granulomas. Five to six mice per group. (Bottom) Histologic appearances of type 2 (SEA) bead granulomas in CCR8+/+ and CCR8−/− (original magnifications: ×400; inset, ×800). All observations were repeated in three separate experiments. Bars are means ± SEM. *P < 0.05 comparing CCR8+/+ to CCR8−/−. Findings were similar in separate studies using either 129sv or 129sv × C57BL/6 F2 background mice. Lym, lymphocytes; Mac, macrophages; Eos, eosinophils; Neu, neutrophils.
Figure 2
Figure 2
Effect of CCR8 deletion on secondary type 1 (PPD) and type 2 (SEA) granuloma formation. Groups of CCR8+/+ (129 × B6) and CCR8−/− (129 × B6) mice were sensitized subcutaneously with M. bovis PPD in Freund's adjuvant or intraperitoneally with 3,000 S. mansoni eggs. After 14 d of sensitization, lung granulomas were elicited with 6,000 PPD or SEA Ag-coated beads. Granulomas were examined on day 4 after bead challenge. (Top left) Type 1 and type 2 granuloma cross-sectional areas. (Top right) Cellular composition of type 1 and type 2 lung granulomas. Five to six mice per group. (Bottom) Histologic appearances of type 2 (SEA) bead granulomas in CCR8+/+ and CCR8−/− (original magnifications: ×400; inset, ×800). All observations were repeated in three separate experiments. Bars are means ± SEM. *P < 0.05 comparing CCR8+/+ to CCR8−/−. Findings were similar in separate studies using either 129sv or 129sv × C57BL/6 F2 background mice. Lym, lymphocytes; Mac, macrophages; Eos, eosinophils; Neu, neutrophils.
Figure 4
Figure 4
Effect of CCR8 deletion on cytokine profiles in draining lymph nodes cultures during secondary type 1 (PPD) and type 2 (SEA) granuloma formation. Lung granulomas were induced in CCR8+/+ (129 × B6) and CCR8−/− (129 × B6), as described in Materials and Methods, then on day 4 draining lymph nodes were collected and cultured. Bars are means ± SEM of Ag-elicited cytokine levels from a representative experiment. (Top) Type 1 (PPD) response; (bottom) type 2 (SEA) response. Five to six animals per group. All observations were repeated in three separate experiments and findings were similar using either 129sv or 129sv × C57BL/6 F2 background mice. *P < 0.05 comparing CCR8+/+ to CCR8−/−.
Figure 5
Figure 5
Reduced eosinophil accumulation in CCR8−/− mice in ovalbumin allergic airway inflammation. (A) Histologic appearance of peribronchial eosinophil accumulation in lungs from ovalbumin sensitized and rechallenged CCR8+/+ (129 × B6) and CCR8−/− (129 × B6) mice (original magnification: ×400); (B) direct quantitation of eosinophils in BAL fluid. Bars represent means ± SEM. *P < 0.05 compared with sensitized control +/+ mice. Findings were similar in separate studies using either 129sv or 129sv × C57BL/6 F2 background mice.
Figure 5
Figure 5
Reduced eosinophil accumulation in CCR8−/− mice in ovalbumin allergic airway inflammation. (A) Histologic appearance of peribronchial eosinophil accumulation in lungs from ovalbumin sensitized and rechallenged CCR8+/+ (129 × B6) and CCR8−/− (129 × B6) mice (original magnification: ×400); (B) direct quantitation of eosinophils in BAL fluid. Bars represent means ± SEM. *P < 0.05 compared with sensitized control +/+ mice. Findings were similar in separate studies using either 129sv or 129sv × C57BL/6 F2 background mice.
Figure 6
Figure 6
Reduced peribronchial eosinophil accumulation in cockroach allergen–sensitized CCR8−/− mice. (A) Histologic appearance of peribronchial eosinophil accumulation in lungs from CRA-sensitized and rechallenged CCR8+/+ and CCR8−/− mice; (B) morphometric enumeration of peribronchial eosinophils in CCR8+/+ and CCR8−/− mice; (C) parallel analysis of EPO in the BAL fluid of the CCR8+/+ (129sv) and CCR8−/− (129sv) mice. Bars represent the means ± SEM of five mice. *P < 0.05. Findings were similar in separate studies using either 129sv or 129sv × C57BL/6 F2 background mice. HPF, high power field.
Figure 6
Figure 6
Reduced peribronchial eosinophil accumulation in cockroach allergen–sensitized CCR8−/− mice. (A) Histologic appearance of peribronchial eosinophil accumulation in lungs from CRA-sensitized and rechallenged CCR8+/+ and CCR8−/− mice; (B) morphometric enumeration of peribronchial eosinophils in CCR8+/+ and CCR8−/− mice; (C) parallel analysis of EPO in the BAL fluid of the CCR8+/+ (129sv) and CCR8−/− (129sv) mice. Bars represent the means ± SEM of five mice. *P < 0.05. Findings were similar in separate studies using either 129sv or 129sv × C57BL/6 F2 background mice. HPF, high power field.
Figure 7
Figure 7
Reduced cytokine levels in the lungs of cockroach allergen challenged CCR8−/− mice. Aqueous extracts were prepared from whole snap frozen lungs of allergen-challenged CCR8+/+ (129sv) and CCR8−/− (129sv) mice at 6 h after challenge, then assayed for cytokines with values expressed as amount per whole lung. (A) IL-4 levels; (B) IL-5 levels; and (C) IL-13 levels. Bars represent the mean ± SEM of individual lungs of four mice. *P < 0.05. Findings were similar in separate studies using either 129sv or 129sv × C57BL/6 F2 background mice.
Figure 8
Figure 8
Circulating eosinophils lack CCR8 mRNA and are unresponsive to CCR8 ligands. (A) Eosinophils isolated from the blood of IL-5 transgenic mice were examined for expression of CCR3 and CCR8 by RT-PCR. CCR3 (184-bp band) expression was detected in mouse eosinophils (2 × 10⁵ cells). CCR8 expression was not detected in circulating eosinophils. CCR8 transcript (411-bp band) was detected in wild-type thymocytes, but not in thymocytes from CCR8−/− mice (negative control). GAPDH (540-bp band) was included as a procedural control. (B) Eosinophils (blood) were also examined for their ability to flux calcium in response to CCR3 and CCR8 ligands. Human and mouse eotaxin (100 ng/ml) both generated a significant transient calcium flux, whereas TCA3 and I-309 (100 ng/ml, respectively) were ineffective in this assay.
Figure 9
Figure 9
Blood and bone marrow eosinophil mobilization as related to serum IL-5 levels in CCR8+/+ and CCR8−/− mice with secondary type 2 (SEA) granulomas. Lung granulomas were induced in CCR8+/+ and CCR8−/− as described in Materials and Methods, then on day 4, blood, bone marrow, and serum was evaluated. (A) Peripheral blood eosinophil counts; (B) bone marrow eosinophil differentiation index; (C) serum IL-5 levels. CCR8+/+ (129 × B6; black bars); CCR8−/− (129×B6; shaded bars); untreated mice (white bars). Untreated CCR8+/+ and CCR8−/− controls were statistically equivalent. *P < 0.05 comparing sensitized CCR8+/+ by ANOVA. Findings were similar in separate studies using either 129sv or 129sv × C57BL/6 F2 background mice.
Figure 10
Figure 10
CCR8 is not required for in vitro development of Th2 cells. Naive CD4+ T cells from CCR8+/+ (129sv) or CCR8−/− (129sv) mice were stimulated with anti-CD3 and anti-CD28 mAbs, in the presence of medium alone (neutral conditions), IL-12 plus anti–IL-4 mAbs (Th1 conditions), or IL-4 plus anti–IFN-γ mAbs (Th2 conditions), and then harvested after 6 d and restimulated for analysis of intracellular cytokine production by flow cytometry (IL-4, IL-5, and IFN-γ).

References

    1. Baggiolini M. Chemokines and leukocyte traffic. Nature. 1998;392:565–568. - PubMed
    1. Strieter R.M., Polverini P.J., Arenberg D.A., Kunkel S.L. The role of CXC chemokines as regulators of angiogenesis. Shock. 1995;4:155–160. - PubMed
    1. Taub D.D., Turcovski-Corrales S.M., Key M.L., Longo D.L., Murphy W.J. Chemokines and T lymphocyte activationI. Beta chemokines costimulate human T lymphocyte activation in vitro. J. Immunol. 1996;156:2095–2103. - PubMed
    1. Taub D.D., Ortaldo J.R., Turcovski-Corrales S.M., Key M.L., Longo D.L., Murphy W.J. Beta chemokines costimulate lymphocyte cytolysis, proliferation, and lymphokine production. J. Leuk. Biol. 1996;59:81–89. - PubMed
    1. Sallusto F. The role of chemokines and chemokine receptors in T cell priming and Th1/Th2-mediated responses. Haematologica. 1999;84:28–31. - PubMed

Publication types

MeSH terms