. 2001 Mar 5;193(5):643-50.
doi: 10.1084/jem.193.5.643.

An instructive component in T helper cell type 2 (Th2) development mediated by GATA-3

Affiliations

An instructive component in T helper cell type 2 (Th2) development mediated by GATA-3

J D Farrar et al. J Exp Med. .

Abstract

Although interleukin (IL)-12 and IL-4 polarize naive CD4(+) T cells toward T helper cell type 1 (Th1) or Th2 phenotypes, it is not known whether cytokines instruct the developmental fate in uncommitted progenitors or select for outgrowth of cells that have stochastically committed to a particular fate. To distinguish these instructive and selective models, we used surface affinity matrix technology to isolate committed progenitors based on cytokine secretion phenotype and developed retroviral-based tagging approaches to directly monitor individual progenitor fate decisions at the clonal and population levels. We observe IL-4-dependent redirection of phenotype in cells that have already committed to a non-IL-4-producing fate, inconsistent with predictions of the selective model. Further, retroviral tagging of naive progenitors with the Th2-specific transcription factor GATA-3 provided direct evidence for instructive differentiation, and no evidence for the selective outgrowth of cells committed to either the Th1 or Th2 fate. These data would seem to exclude selection as an exclusive mechanism in Th1/Th2 differentiation, and support an instructive model of cytokine-driven transcriptional programming of cell fate decisions.


Figures

Figure 1
Figure 1
IL-4– and Stat6-independent commitment to IL-4–producing phenotype. DO11.10 TCR transgenic wild-type (A–C) or DO11.10 Stat6-deficient (Stat6−/−, D–F) T cells were stimulated with OVA (0.5 mg/ml chicken OVA) with the addition of IL-12 (10 U/ml) and 11B11 (10 μg/ml; Th1; A and D), the addition of IL-4 (100 U/ml), anti–IFN-γ (H22, 10 μg/ml) and anti–IL-12 (Tosh, 10 μg/ml; Th2; B and E), or with addition of anti–IL-12, anti–IFN-γ, and anti–IL-4 (Th0; C and F), as described (reference 17). 7 d after activation, cells were restimulated with PMA and ionomycin for 4 h followed by analysis of IL-4 and IFN-γ production by intracellular staining as described previously (references 20, 21, and 26). Gates for analysis excluded dead cells and quadrants were set based on isotype control stainings (reference 26). The percentages displayed indicate the frequency of cells positive for IL-4 or IFN-γ within the live cell gates.
Figure 3
Figure 3
Clonal analysis of commitment in Stat6-deficient T cells infected with control or GATA-3–expressing retroviruses. (a) Comparisons of predictions of selective and instructive models. Progenitors committed to either an IL-4–producing (shaded circles) or a non–IL-4–producing phenotype (open circles) are infected with control retrovirus or GATA-3–expressing retrovirus. The selective model predicts GATA-3 to promote outgrowth of cells and not to affect their differentiation, whereas the instructive model predicts that GATA-3 should promote the differentiation of all progenitors to the IL-4–producing fate. (b) Stat6-deficient DO11.10 cells were activated with OVA under Th1 or Th2 conditions (reference 17). 36 h after activation, cells were infected with a mixture of two retroviruses, GFPRV and a GATA-3–expressing retrovirus (GATA3-GFP; reference 27). 7 d after activation, GFP-expressing CD4+ T cells were purified and cloned by flow cytometric sorting and single-cell deposition into 96-well plates containing irradiated BALB/c splenocytes and OVA. After expansion, independent clones were restimulated on anti-CD3–coated plates for 24 h and supernatants analyzed for IL-4 and IFN-γ secretion by ELISA (reference 28). The retrovirus infecting the clone was then determined by genomic PCR analysis. Cytokine production by individual clones derived from Th1 or Th2 conditions is presented in A and B. Cytokine production of clones segregated by the identity of the infecting retrovirus is presented in C–F.
Figure 3
Figure 3
Clonal analysis of commitment in Stat6-deficient T cells infected with control or GATA-3–expressing retroviruses. (a) Comparisons of predictions of selective and instructive models. Progenitors committed to either an IL-4–producing (shaded circles) or a non–IL-4–producing phenotype (open circles) are infected with control retrovirus or GATA-3–expressing retrovirus. The selective model predicts GATA-3 to promote outgrowth of cells and not to affect their differentiation, whereas the instructive model predicts that GATA-3 should promote the differentiation of all progenitors to the IL-4–producing fate. (b) Stat6-deficient DO11.10 cells were activated with OVA under Th1 or Th2 conditions (reference 17). 36 h after activation, cells were infected with a mixture of two retroviruses, GFPRV and a GATA-3–expressing retrovirus (GATA3-GFP; reference 27). 7 d after activation, GFP-expressing CD4+ T cells were purified and cloned by flow cytometric sorting and single-cell deposition into 96-well plates containing irradiated BALB/c splenocytes and OVA. After expansion, independent clones were restimulated on anti-CD3–coated plates for 24 h and supernatants analyzed for IL-4 and IFN-γ secretion by ELISA (reference 28). The retrovirus infecting the clone was then determined by genomic PCR analysis. Cytokine production by individual clones derived from Th1 or Th2 conditions is presented in A and B. Cytokine production of clones segregated by the identity of the infecting retrovirus is presented in C–F.
Figure 2
Figure 2
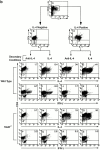
Redirection of committed non–IL-4–producing progenitors is IL-4 dependent and requires Stat6. (a) Comparison of predictions of selective and instructive models. Cells that have either committed to an IL-4–producing phenotype (shaded circles) or a non–IL-4–producing phenotype (open circles) are separately reactivated in a secondary stimulation. The instructive differentiation model allows cytokine-dependent redirection, whereas the selective model does not. (b) Wild-type or Stat6-deficient (Stat6−/−) DO11.10 cells were activated by OVA in the presence of anti–IL-12, anti–IFN-γ, and anti–IL-4 for 7 d as described (reference 17; A). Cells were reactivated and purified by cellular affinity matrix technology and flow cytometric sorting into IL-4–nonsecreting (IL-4 Negative; B) and IL-4–secreting (IL-4 Positive; C) populations. After sorting, cells were returned to culture and were reactivated with OVA and irradiated BALB/c splenocytes either in the presence of IL-4 (100 U/ml; E, G, I, K, M, O, Q, and S) or neutralizing anti–IL-4 mAb (11B11; D, F, H, J, L, N, P, and R). After 7 d, cells were stimulated with PMA and ionomycin for 4 h followed by analysis of mCD4 expression and IL-4 (D to G and L to O) and IFN-γ (H to K and P to S) production by intracellular staining. Analysis gates exclude dead cells. Quadrants were set based on isotype control staining as described (reference 26), and the percentage in the top right quadrant indicates the frequency of cells positive for cytokine production. These experiments were performed three times with consistent results.
Figure 2
Figure 2
Redirection of committed non–IL-4–producing progenitors is IL-4 dependent and requires Stat6. (a) Comparison of predictions of selective and instructive models. Cells that have either committed to an IL-4–producing phenotype (shaded circles) or a non–IL-4–producing phenotype (open circles) are separately reactivated in a secondary stimulation. The instructive differentiation model allows cytokine-dependent redirection, whereas the selective model does not. (b) Wild-type or Stat6-deficient (Stat6−/−) DO11.10 cells were activated by OVA in the presence of anti–IL-12, anti–IFN-γ, and anti–IL-4 for 7 d as described (reference 17; A). Cells were reactivated and purified by cellular affinity matrix technology and flow cytometric sorting into IL-4–nonsecreting (IL-4 Negative; B) and IL-4–secreting (IL-4 Positive; C) populations. After sorting, cells were returned to culture and were reactivated with OVA and irradiated BALB/c splenocytes either in the presence of IL-4 (100 U/ml; E, G, I, K, M, O, Q, and S) or neutralizing anti–IL-4 mAb (11B11; D, F, H, J, L, N, P, and R). After 7 d, cells were stimulated with PMA and ionomycin for 4 h followed by analysis of mCD4 expression and IL-4 (D to G and L to O) and IFN-γ (H to K and P to S) production by intracellular staining. Analysis gates exclude dead cells. Quadrants were set based on isotype control staining as described (reference 26), and the percentage in the top right quadrant indicates the frequency of cells positive for cytokine production. These experiments were performed three times with consistent results.
Figure 4
Figure 4
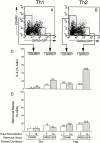
Intrinsic GATA-3–mediated signaling induces IL-4 expression without promoting selective cell outgrowth. Stat6-deficient DO11.10 splenocytes were activated with OVA under Th1 or Th2 conditions (reference 17). 36 h after activation, cells were infected with a mixture of two retroviral vectors containing control retrovirus expressing human CD4 extracellular domain marker protein (CD4RV) and the GATA-3–expressing retrovirus expressing a GFP marker protein (GATA3-GFP; reference 17). 7 d after primary activation, each culture was analyzed for GFP, hCD4, and intracellular IL-4 by FACS® analysis (A and B). The remaining cells were restimulated with irradiated BALB/c splenocytes and OVA for an additional 7 d. After secondary stimulation, the cells were analyzed for expression of GFP, hCD4, and intracellular IL-4. Shown are FACS® analyses of T cell cultures developed under Th1 (A) or Th2 (B) conditions and analyzed for the expression of the retroviral markers GFP (bottom right polygon) and human CD4 (top left polygon). (C) T cells expressing intracellular IL-4 are calculated as a percentage of cells expressing the gated retroviral marker proteins from cultures analyzed 7 d (white bars) and 14 d (stippled bars) after primary activation. (D) T cells expressing the retroviral marker proteins (polygon gates, top panels) are expressed as a percentage of the total number of live cells. Data from replicate analyses are presented in Table .

Similar articles

Cited by

References

    1. Coffman R.L., Reiner S.L. Instruction, selection, or tampering with the odds? Science. 1999;284:1283. - PubMed
    1. Agarwal S., Rao A. Modulation of chromatin structure regulates cytokine gene expression during T cell differentiation. Immunity. 1998;9:765–775. - PubMed
    1. Murphy K.M., Ouyang W., Farrar J.D., Yang J., Ranganath S., Asnagli H., Afkarian M., Murphy T.L. Signaling and transcription in T helper development. Annu. Rev. Immunol. 2000;18:451–494. - PubMed
    1. Kaplan M.H., Sun Y.L., Hoey T., Grusby M.J. Impaired IL-12 responses and enhanced development of Th2 cells in Stat4-deficient mice. Nature. 1996;382:174–177. - PubMed
    1. Thierfelder W.E., van Deursen J.M., Yamamoto K., Tripp R.A., Sarawar S.R., Carson R.T., Sangster M.Y., Vignali D.A., Doherty P.C., Grosveld G.C., Ihle J.N. Requirement for Stat4 in interleukin-12-mediated responses of natural killer and T cells. Nature. 1996;382:171–174. - PubMed

Publication types

MeSH terms