. 2001 Mar;21(5):1552-64.
doi: 10.1128/MCB.21.5.1552-1564.2001.

Change of the death pathway in senescent human fibroblasts in response to DNA damage is caused by an inability to stabilize p53

Affiliations

Change of the death pathway in senescent human fibroblasts in response to DNA damage is caused by an inability to stabilize p53

A Seluanov et al. Mol Cell Biol. 2001 Mar.

Abstract

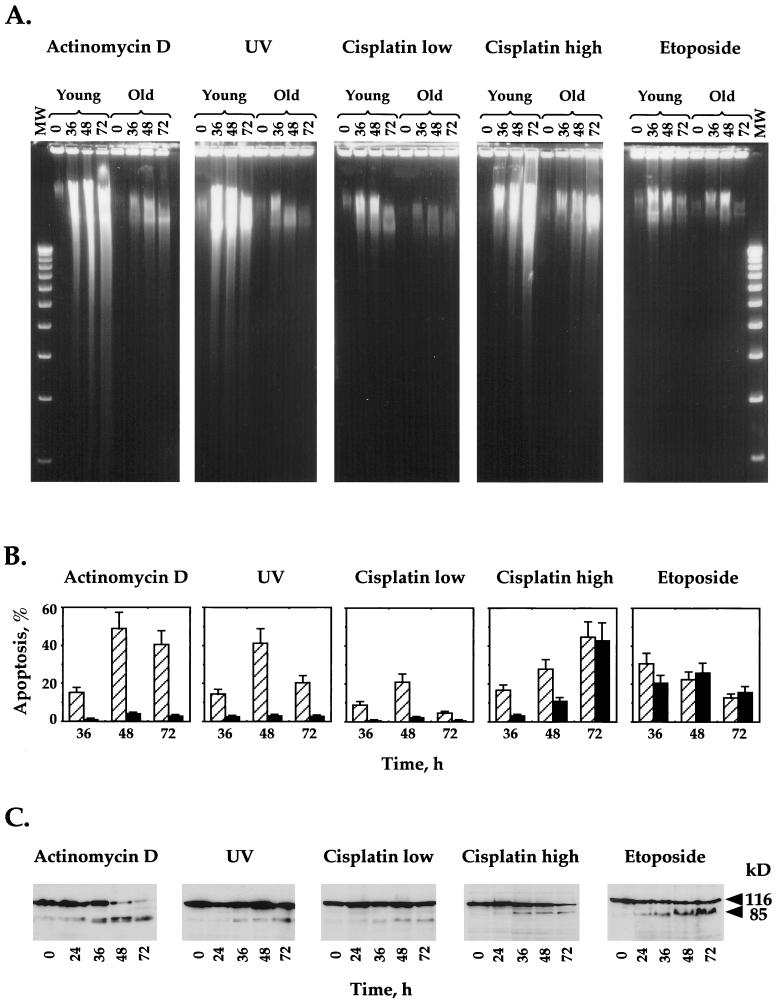
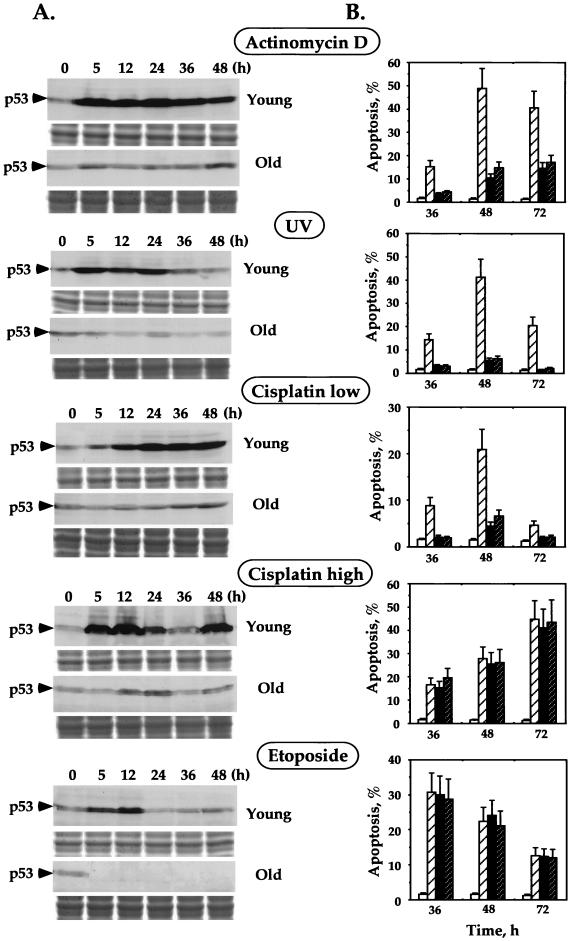
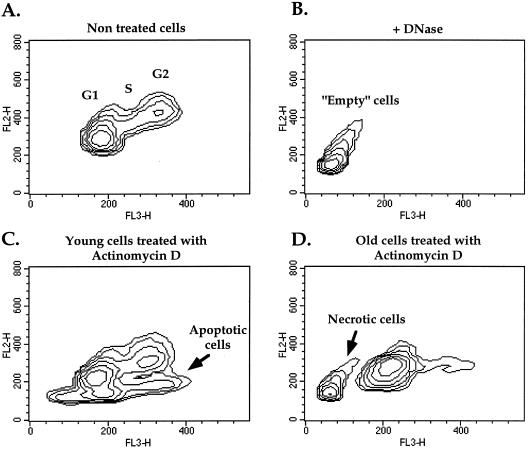
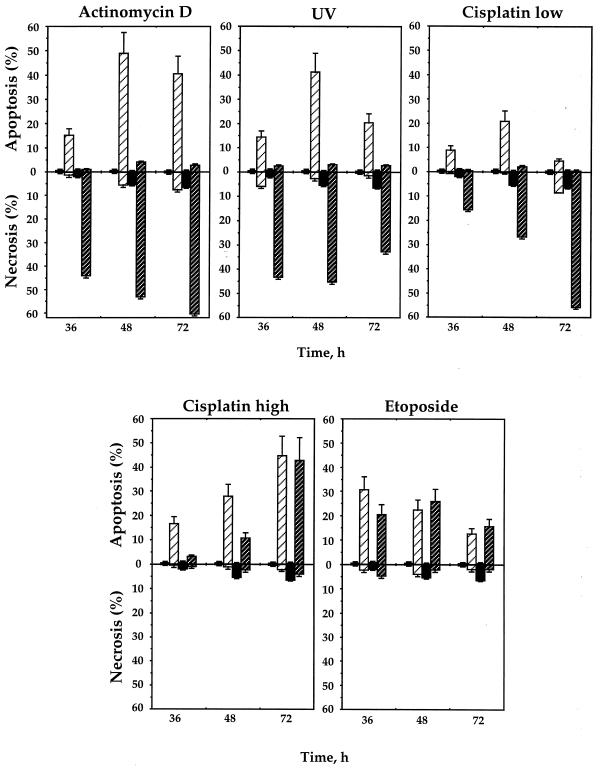
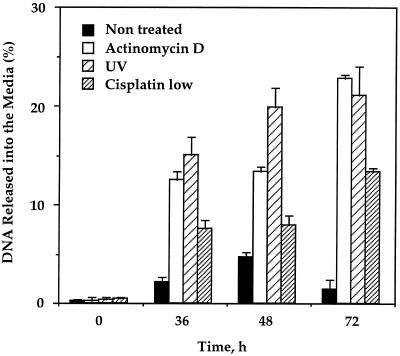
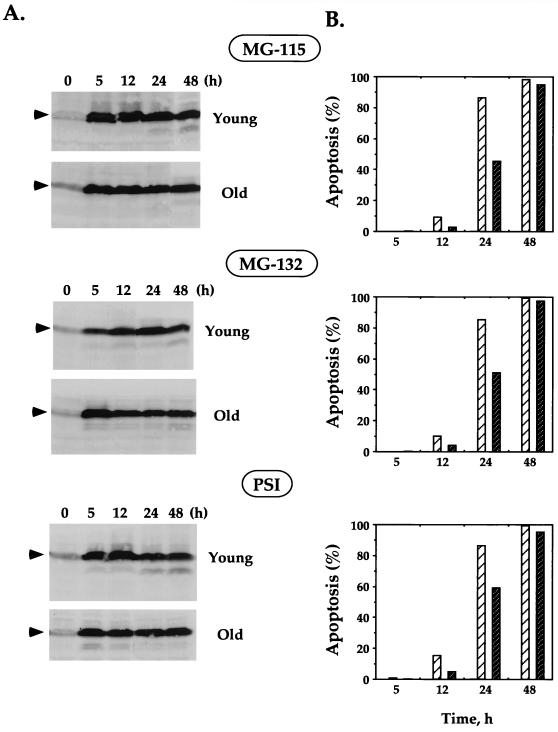
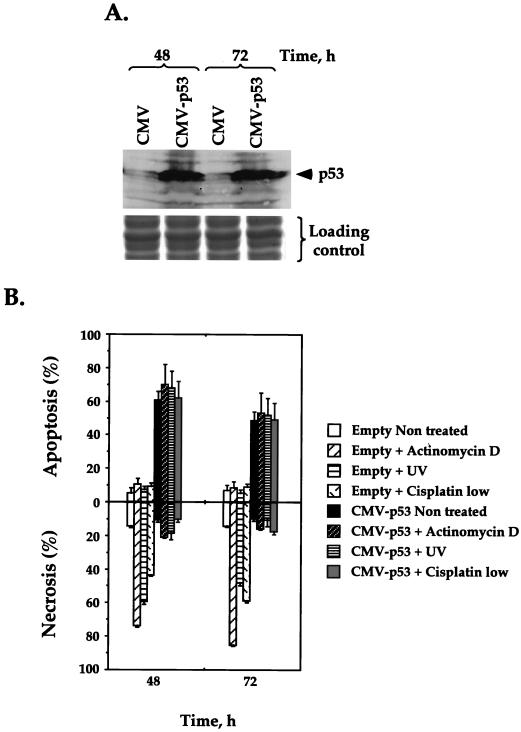
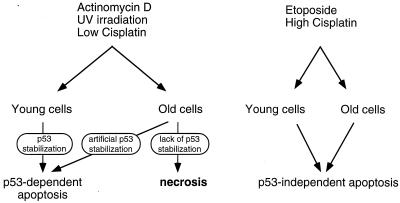
The cellular function of p53 is complex. It is well known that p53 plays a key role in cellular response to DNA damage. Moreover, p53 was implicated in cellular senescence, and it was demonstrated that p53 undergoes modification in senescent cells. However, it is not known how these modifications affect the ability of senescent cells to respond to DNA damage. To address this question, we studied the responses of cultured young and old normal diploid human fibroblasts to a variety of genotoxic stresses. Young fibroblasts were able to undergo p53-dependent and p53-independent apoptosis. In contrast, senescent fibroblasts were unable to undergo p53-dependent apoptosis, whereas p53-independent apoptosis was only slightly reduced. Interestingly, instead of undergoing p53-dependent apoptosis, senescent fibroblasts underwent necrosis. Furthermore, we found that old cells were unable to stabilize p53 in response to DNA damage. Exogenous expression or stabilization of p53 with proteasome inhibitors in old fibroblasts restored their ability to undergo apoptosis. Our results suggest that stabilization of p53 in response to DNA damage is impaired in old fibroblasts, resulting in induction of necrosis. The role of this phenomenon in normal aging and anticancer therapy is discussed.


Figures

FIG. 1
FIG. 1
Apoptosis in young and old normal human fibroblasts induced by DNA-damaging agents. Young and old fibroblasts were treated with various DNA-damaging agents (actinomycin D, UV, etoposide, and low [1-μg/ml] and high [10-μg/ml] concentrations of cisplatin), and induction of apoptosis was analyzed by DNA ladder (A), acridine orange staining for chromatin condensation (B), and PARP cleavage (C). (A) After 0, 36, 48, and 72 h of induction, all detached and adherent fibroblasts were collected, and equal numbers of the cells were directly subjected to gel electrophoresis as described in Materials and Methods. MW, 1-kb ladder standard. (B) Percent apoptosis was determined by FACS analysis after acridine orange staining of fibroblasts treated with genotoxic agents. The hatched bars represent young fibroblasts, and the solid bars represent old fibroblasts. All of the experiments were repeated at least three times, and standard errors are shown. (C) Induction of apoptosis in young human fibroblasts was further confirmed by Western blotting with anti-PARP antibodies. The full-length (113-kDa) and apoptosis-specific (89-kDa) fragments of PARP are indicated.
FIG. 2
FIG. 2
Role of p53 in the induction of apoptosis in young and old human fibroblasts. (A) Accumulation of p53 in young and old fibroblasts upon treatment with various DNA-damaging agents. After 0, 5, 12, 24, 36, and 48 h of induction, all detached and adherent fibroblasts were collected, and equal numbers of cells were subjected to SDS-polyacrylamide gel electrophoresis (PAGE) followed by Western blotting with DO-1 anti-p53 antibodies. The blots were stained with India ink to check the equivalence of protein transfer. One-third of each sample was subjected to SDS-PAGE and stained with Coomassie blue to demonstrate equal loading of samples (shown below each Western blot). (B) Inactivation of p53-dependent apoptosis by transient expression of dominant-negative p53 fragment (DD) or human papillomavirus type 16 protein E6. Young fibroblasts transiently transfected with empty vector (hatched bars), plasmid expressing DD (solid bars), or E6 (dark hatched bars) were treated with various DNA-damaging agents for 36, 48, and 72 h. The level of apoptosis was determined by acridine orange staining followed by FACS analysis. The open bars represent the level of apoptosis in the transfected but untreated cells. All the experiments were repeated at least three times, and standard errors are shown.
FIG. 3
FIG. 3
Detection of necrotic and apoptotic cells by acridine orange staining followed by FACS analysis. (A) Density plot of normal cell cycle distribution of untreated fibroblasts. Cell populations at the G1, S, and G2 stages of the cell cycle are indicated. (C) Density plot of empty cells obtained from normal fibroblasts by DNase and RNase treatment for 1.5 h prior to acridine orange staining. This distinct population of empty cells (without DNA and RNA) was used to set the parameters for the identification of the population of necrotic cells. (B and D) Typical examples of young and old fibroblasts undergoing apoptosis or necrosis upon treatment with actinomycin D for 48 h.
FIG. 4
FIG. 4
Induction of apoptosis and necrosis in young and old human fibroblasts by various DNA-damaging agents. After 36, 48, and 72 h of treatment, the cells were stained with acridine orange and analyzed by FACS (see Materials and Methods), which allowed the measurement of both apoptosis and necrosis. The open and solid bars represent untreated young and old cells, respectively. The levels of apoptosis and necrosis in young untreated cells were too low to be seen on the graph. The hatched bars represent the level of apoptosis or necrosis in treated cells, and light and dark hatched bars represent young and old cells, respectively. All the experiments were repeated at least three times, and standard errors are shown.
FIG. 5
FIG. 5
Induction of necrosis in old human fibroblasts by actinomycin D, UV, and low concentration of cisplatin. Necrosis was analyzed by the release of DNA from necrotic cells into the medium. Total DNA of the old fibroblasts was metabolically labeled with BrdU for 24 or 48 h prior to induction. DNA released into the medium upon induction of necrosis was quantified with a cellular DNA fragmentation enzyme-linked immunosorbent assay kit (see Materials and Methods). The percent of released DNA from the total labeled DNA is shown. Experiments were repeated five times, and standard deviations are indicated.
FIG. 6
FIG. 6
Stabilization of p53 and induction of apoptosis in young and old fibroblasts treated with proteasome inhibitors. Young and old fibroblasts were treated with the following proteasome inhibitors: MG-115 (30 μM), MG-132 (10 μM), and PSI (30 μM). (A) Stabilization of p53 at various time points after treatment was analyzed by Western blotting with DO-1 antibodies. The p53 protein is indicated by arrowheads. The blots were stained with India ink to check the equivalence of protein loading and transfer, and the blots showing equal loading and transfer within young and old cells are presented. (B) Induction of apoptosis was analyzed by acridine orange staining followed by FACS analysis. The percent apoptosis in young (light hatched bars) and old (dark hatched bars) cells treated with proteasome inhibitors is shown. The level of apoptosis in untreated cells (young and old) was too low to be seen on the graph. Experiments were repeated at least three times; standard errors were less than 3% of the average and are not shown on the graph.
FIG. 7
FIG. 7
Transient expression of p53 in old fibroblasts restores their ability to undergo apoptosis and inhibits their ability to undergo necrosis. Old fibroblasts were transiently transfected with a plasmid harboring the wild-type p53 gene under the CMV promoter or with the control plasmid containing the CMV promoter alone. The population of transfected cells was enriched using the MACSorter Kk kit. (A) The levels of p53 expression at 48 and 72 h after transfection were analyzed by Western blotting with DO-1 antibodies. The blots were stained with India ink to check the equivalence of protein transfer. One-third of each sample was subjected to SDS-polyacrylamide gel electrophoresis and stained with Coomassie blue to demonstrate equal loading of samples (shown below the Western blot). (B) Immediately following the transfection, cells were subjected to genotoxic stress (actinomycin D, UV, or a low concentration of cisplatin). The levels of induced apoptosis and necrosis 48 and 72 h after treatment were analyzed by acridine orange staining followed by FACS. Experiments were repeated at least three times, and standard errors are shown.
FIG. 8
FIG. 8
Model of the death pathways taken by young and old human fibroblasts in response to various genotoxic stresses.

Similar articles

Cited by

References

    1. Afshari C A, Vojta P J, Annab L A, Futreal P A, Willard T B, Barrett J C. Investigation of the role of G1/S cell cycle mediators in cellular senescence. Exp Cell Res. 1993;209:231–237. - PubMed
    1. Aladjem M I, Spike B T, Rodewald L W, Hope T J, Klemm M, Jaenisch R, Wahl G M. ES cells do not activate p53-dependent stress and undergo p53-independent apoptosis in response to DNA damage. Curr Biol. 1998;8:145–155. - PubMed
    1. Andera L, Wasylyk B. Transcription abnormalities potentiate apoptosis of normal human fibroblasts. Mol Med. 1997;3:852–863. - PMC - PubMed
    1. Atadja P, Wong H, Garkavtsev I, Veillette C, Riabowol K. Increased activity of p53 in senescing fibroblasts. Proc Natl Acad Sci USA. 1995;92:8348–8352. - PMC - PubMed
    1. Baker S J, Markowitz S, Fearon E R, Willson J K V, Vogelstein B. Suppression of human colorectal carcinoma cell growth by wild-type p53. Science. 1990;249:912–915. - PubMed

Publication types

MeSH terms