. 2001 Mar 15;29(6):1293-9.
doi: 10.1093/nar/29.6.1293.

Fully modified 2' MOE oligonucleotides redirect polyadenylation

Affiliations

Fully modified 2' MOE oligonucleotides redirect polyadenylation

T A Vickers et al. Nucleic Acids Res. .

Abstract

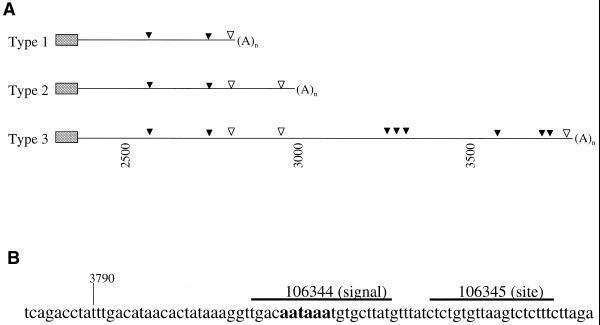
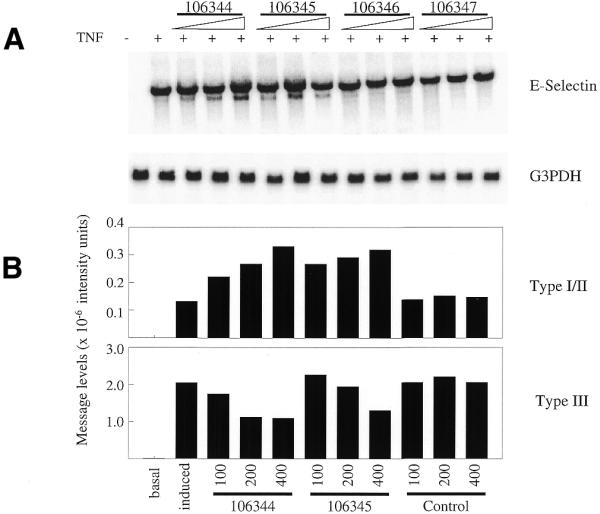
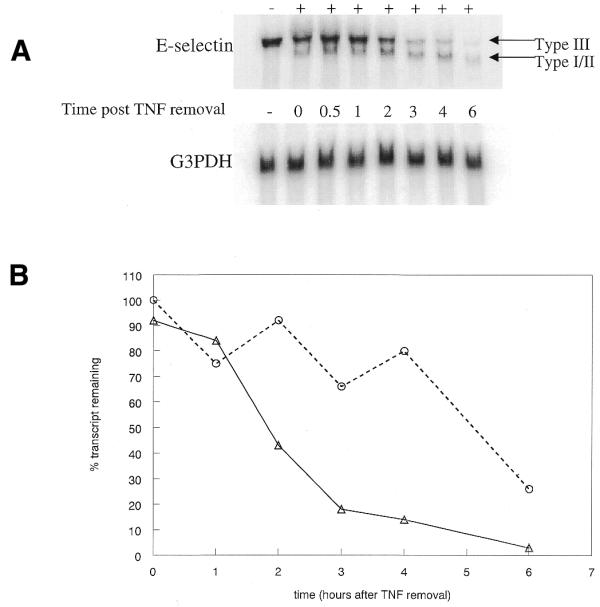
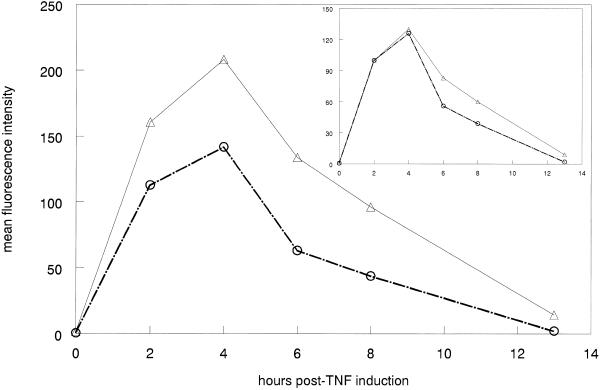
Many genes have been described and characterized that have alternative polyadenylation signals at the 3'-end of their pre-mRNAs. Many of these same messages also contain destabilization motifs responsible for rapid degradation of the mRNA. Polyadenylation site selection can thus determine the stability of an mRNA. Fully modified 2'-O:-methoxy ethyl/phosphorothioate oligonucleotides that hybridize to the 3'-most polyadenylation site or signal of E-selectin were able to inhibit polyadenylation at this site and redirect it to one of two upstream cryptic sites. The shorter transcripts produced after antisense treatment have fewer destabilization sequences, increased mRNA stability and altered protein expression. This study demonstrates that antisense oligonucleotides can be successfully employed to redirect polyadenylation. This is the first demonstration of the use of oligonucleotides to increase, rather than decrease, abundance of a message.


Figures

Figure 1
Figure 1
Schematic illustration of human E-selectin 3′-UTR. (A) Closed triangles, AUUUA mRNA destabilizing elements; open triangles, position of the polyadenylation signal (AAUAAA). (B) The position of antisense oligonucleotides near the Type III polyadenylation site and signal are shown.
Figure 2
Figure 2
Northern blot analysis of antisense-treated HUVEC. (A) HUVEC were oligonucleotide-treated with antisense oligonucleotides directed to the Type III E-selectin poly(A) signal and site or mismatch controls at doses of 50, 100 or 200 nM. E-selectin expression was then stimulated by the addition of TNF. Total RNA was isolated and analyzed by northern blot using an E-selectin probe. The blot was then stripped and probed for G3PDH RNA expression. (B) Following PhosphorImager scanning, intensity of E-selectin expression was accessed using ImageQuant software. Signals were normalized to corresponding G3PDH expression. Corrected image intensity levels of both the long (Type III) and short (Types I and II) messages are plotted.
Figure 3
Figure 3
Oligonucleotide-induced Type I/II message has an altered stability. (A) Cells were treated with 200 nM 106344 then E-selectin expression was stimulated by the addition of TNF at 5 ng/ml. After 2 h, TNF was removed and replaced with fresh media. Cells were harvested at various time-points following TNF removal, RNA isolated, then expression of E-selectin and G3PDH analyzed by northern blot. (B) Type III and Type I/II E-selectin RNA levels were normalized to G3PDH expression then plotted relative to the initial E-selectin level following TNF removal. Triangles, Type III; circles, Type I/II.
Figure 4
Figure 4
Time course of protein expression in 106433 or mismatch-control-treated HUVEC. HUVEC were treated with 106344 or control at 250 nM for 4 h. E-selectin expression was induced by the addition of TNF at 5 ng/ml, which was removed and replaced with fresh media after 2 h. Cells were harvested 0, 2, 4, 6, 8 or 13 h after initiation of TNF treatment, fixed and stained for E-selectin. Cell surface expression was assessed by flow cytometry. Expression given is the mean fluorescent intensity minus the background signal in the absence of TNF. Triangles, 106344 treated; circles, control oligonucleotide. Inset: data normalized to maximal E-selectin expression.
Figure 5
Figure 5
Anchored RT–PCR of E-selectin 3′-ends from antisense-treated HUVEC. (A) Ethidium bromide staining of 1.8% agarose gel containing the products of RT–PCR analysis. Oligonucleotides were administered for 4 h at 200 nM for single oligonucleotide treatment or 150 nM each for dual oligonucleotide treatment. Treated cells were incubated overnight prior to TNF induction of the E-selectin message: –, no TNF treatment; +, 5 ng/ml TNF for 2 h. Bold arrows, expected positions of the Types I, II and III transcripts; thin arrow, expected length of product for the variant poly(A) signal. (B) Diagrammatic representation of the oligonucleotide target sites and position of the PCR primers.

Similar articles

Cited by

References

    1. Gautheret D., Poirot,O., Lopez,F., Audic,S. and Claverie,J.M. (1998) Alternate polyadenylation in human mRNAs: a large-scale analysis by EST clustering. Genome Res., 8, 524–530. - PubMed
    1. Shaw G. and Kamen,R. (1986) A conserved AU sequence from the 3′ untranslated region of GM-CSF mRNA mediated selective mRNA degradation. Cell, 46, 659–667. - PubMed
    1. Wahle E. and Keller,W. (1996) The biochemistry of polyadenylation. Trends Biochem. Sci., 21, 247–250. - PubMed
    1. Edwalds-Gilbert G., Veraldi,K.L. and Milcarek,C. (1997) Alternative poly(A) site selection in complex transcription units: means to an end? Nucleic Acids Res., 25, 2547–2561. - PMC - PubMed
    1. Denome R.M. and Cole,C.N. (1988) Patterns of polyadenylation site selection in gene constructs containing multiple polyadenylation signals. Mol. Cell. Biol., 8, 4829–4839. - PMC - PubMed

MeSH terms