. 2001 Mar 15;29(6):1308-16.
doi: 10.1093/nar/29.6.1308.

Molecular cloning of Ian4: a BCR/ABL-induced gene that encodes an outer membrane mitochondrial protein with GTP-binding activity

Affiliations

Molecular cloning of Ian4: a BCR/ABL-induced gene that encodes an outer membrane mitochondrial protein with GTP-binding activity

L Dahéron et al. Nucleic Acids Res. .

Abstract

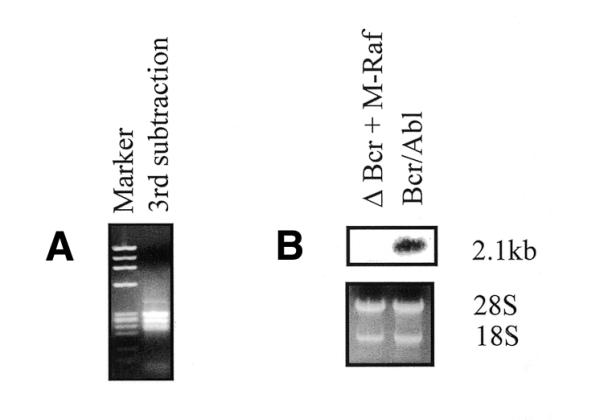
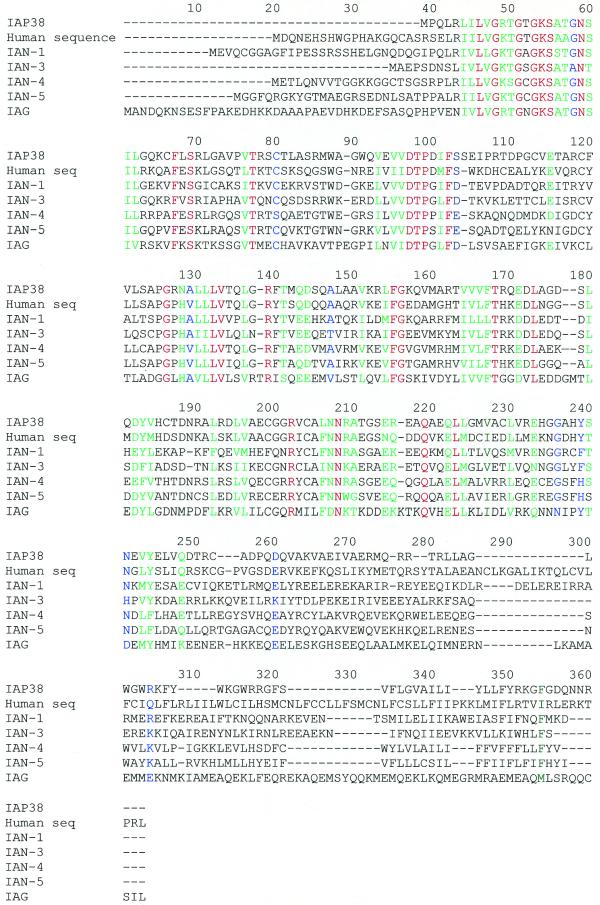
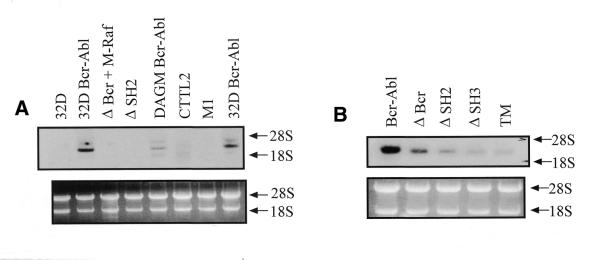
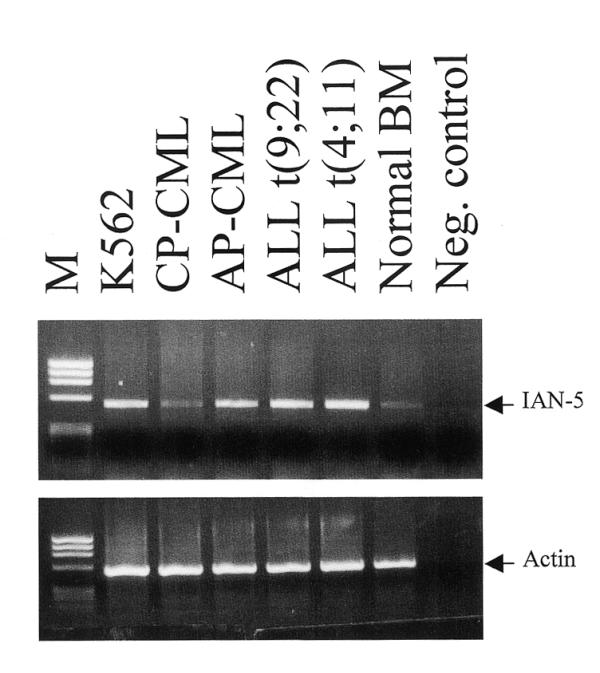
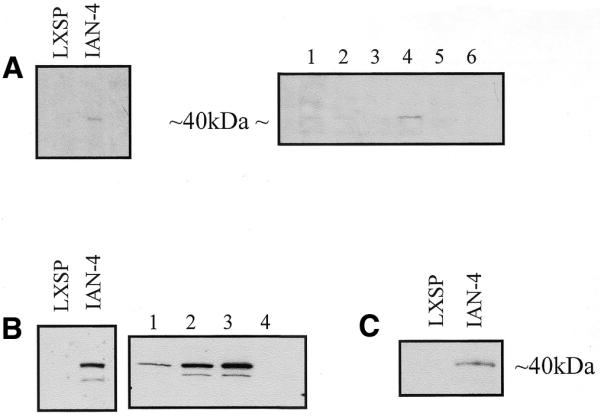
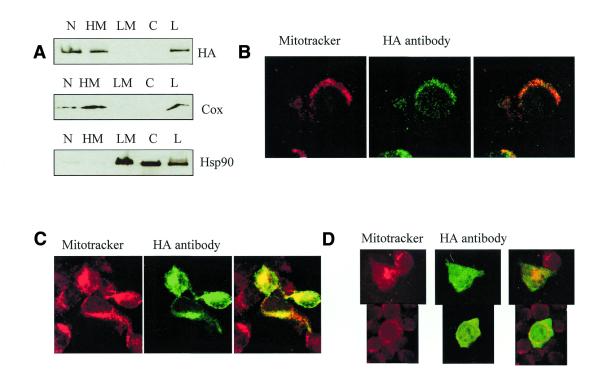
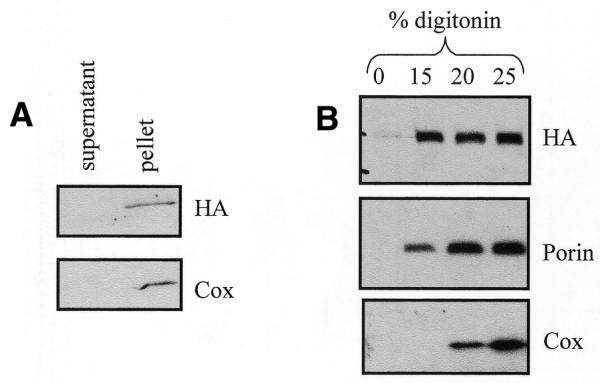
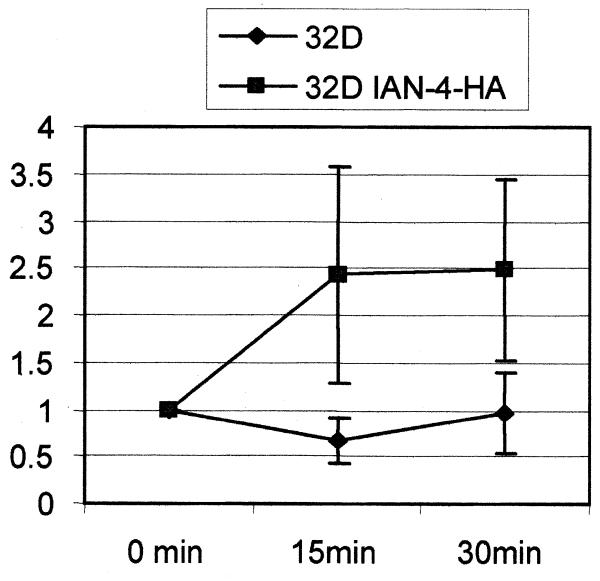
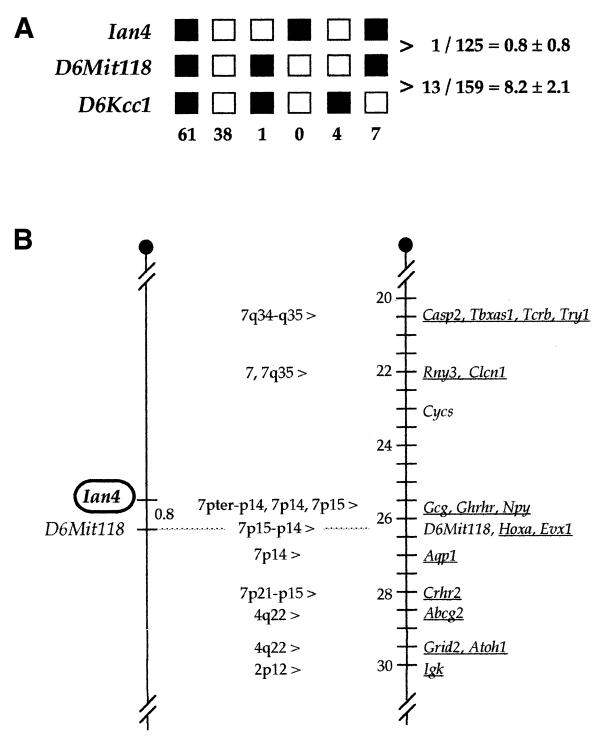
Using the representation difference analysis technique, we have identified a novel gene, Ian4, which is preferentially expressed in hematopoietic precursor 32D cells transfected with wild-type versus mutant forms of the Bcr/Abl oncogene. Ian4 expression was undetectable in 32D cells transfected with v-src, oncogenic Ha-ras or v-Abl. Murine Ian4 maps to chromosome 6, 25 cM from the centromere. The Ian4 mRNA contains two open reading frames (ORFs) separated by 5 nt. The first ORF has the potential to encode for a polypeptide of 67 amino acids without apparent homology to known proteins. The second ORF encodes a protein of 301 amino acids with a GTP/ATP-binding site in the N-terminus and a hydrophobic domain in the extreme C-terminus. The IAN-4 protein resides in the mitochondrial outer membrane and the last 20 amino acids are necessary for this localization. The IAN-4 protein has GTP-binding activity and shares sequence homology with a novel family of putative GTP-binding proteins: the immuno-associated nucleotide (IAN) family.


Figures

Figure 1
Figure 1
RDA of cDNA from ΔBCR + M-Raf and Bcr/Ab1-expressing cells. (A) Product of the third subtraction loaded onto an ethidium bromide–agarose gel. (B) Northern blot shows differential expression of Ian4 mRNA in the two cell lines. Total RNA (10 µg) was electrophoresed, blotted onto a nylon membrane and hybridized with a 32P-labeled Ian4 probe. The gel was visualized under UV light to verify equal RNA loading.
Figure 2
Figure 2
Alignment of IAP38, a human sequence (GenBank accession no. AL110151), IAN-5, IAN-1, IAN-3 and IAG-1 protein sequences. The alignment was performed using CLUSTALW. Red, identical amino acids; green, conserved amino acids; blue, identical or conserved in most members of the family.
Figure 3
Figure 3
Expression pattern of Ian4: total RNA from (A) different cell lines and (B) 32D cells transfected with mutant BCR/ABL was hybridized with a 32P-labeled Ian4 probe. The gel was visualized under UV light to verify equal RNA loading.
Figure 4
Figure 4
Expression pattern of Ian5: total RNA from the indicated cells was reverse transcribed with random hexamers and Moloney murine leukemia virus reverse transcriptase; the resulting cDNA was amplified (30 cycles) with Ian5 specific primers (upstream primer, 5′-TGAGACATGTGGTCATCCTCTTC-3′; reverse primer, 5′-GAAGTGCTCCAGGGTCCAGAGATT-3′) or with β-actin (5′ primer, 5′-CGTGGGGCGCCCCAGGCACCA-3′; reverse primer, 5′-CTCCTTAATGTCACGCACGATTTC-3′) primers and 5 U of Taq DNA polymerase. The negative control (Neg. control) is a PCR reaction in the absence of template cDNA.
Figure 5
Figure 5
Expression of HA-tagged IAN-4: total lysate from mixed cell populations or clones of 32D cells stably transfected with the LXSP vector containing (A) the full-length Ian4 cDNA or (B) a truncated cDNA lacking sequences coding for the uORF with an in-frame C-terminal HA epitope was fractionated by SDS–PAGE and transferred to a nylon membrane before immunoblotting with an anti-HA antibody and detection by enhanced chemiluminescence. (C) BCR/ABL-expressing 32D cells were transfected with LXSP vector containing the full-length cDNA including both ORFs.
Figure 6
Figure 6
Figure 6. Subcellular localization of IAN-4–HA: (A) western blot of total lysates (L) and subcellular fractions (N, HM, LM, C) of 32D stably transfected with Ian4–HA. Fractions were separated by SDS–PAGE before immunoblotting with an anti-HA antibody, an anti-COX and an anti-HSP90 antibody. Immunocytochemistry of (B) 32D cells stably transfected with Ian4–HA and of (C) 293T cells transiently transfected with HA–Ian4 or (D) HA–Ian4 with a deletion of the C-terminal 20 amino acids. Cells were stained with Mitotracker and visualized by the Alexa 488 antibody reacting with the anti-HA antibody.
Figure 7
Figure 7
Submitochondrial localization of IAN-4–HA: western blot shows IAN-4–HA expression in (A) sodium carbonate- or (B) digitonin-treated mitochondrial fractions.
Figure 8
Figure 8
GTP-binding activity of IAN-4: GTP-binding activity of immunoprecipitated IAN-4–HA was measured at the indicated times by the nitrocellulose filtration assay as described in Materials and Methods. The y-axis represents the increase (x-fold) in radioactivity corresponding to the increase in [α-32P]GTP bound to the IAN-4–HA immunoprecipitate.
Figure 9
Figure 9
(A) Haplotype analysis of N2 progeny from the interspecific backcross: loci followed in the backcross are listed to the left. Each column represents the chromosome identified in the N2 offspring that was inherited from the (AEJ/Gn × M.spretus) F1 parent. Black squares represent the AEJ/Gn allele and white squares represent the M.spretus allele. The number of N2 progeny carrying each type of chromosome is listed at the bottom. Mapping of the D6Kcc1 and D6Mit118 loci was reported previously for this cross (17). Total mice counted for pairwise combinations are listed on the right along with average distances ± standard error (in cM). (B) Genetic linkage maps showing the chromosomal localization of Ian4 on mouse chromosome 6. The map on the left represents loci typed in the interspecific mouse backcross (described in Materials and Methods). Genetic distances between loci are given in cM. The map on the right represents a portion of the consensus linkage map for mouse chromosome 6 [Mouse Genome Informatics (MGI), January, 2000]. Genes that have been mapped in the human genome are underlined and the corresponding position in the human genome is listed between the maps. Although this comparison suggests that the human Ian4 gene may reside on chromosome 7p15–p14, a specific position is difficult to predict unequivocally because the Lo1 gene lies in a region that shows a break in homology between human chromosome 7p15–p14 and 7q34–q35. The dotted line between the chromosomes indicates that D6Mit118 was used to align the maps.

Similar articles

Cited by

References

    1. Clark S.S., McLaughlin,J., Timmonis,M., Pendergast,A.M., Ben-Neriah,Y., Dow,L., Rovera,G., Smith,S.D. and Witte,O.N. (1988) Expression of a distinctive BCR/ABL oncogene in Ph1-positive acute lymphocytic leukemia (ALL). Science, 239, 775–779. - PubMed
    1. Ben-Neriah Y., Daley,G.Q., Mes-Masson,A.M, Witte,O.N. and Baltimore,D. (1986) The chronic myelogenous leukemia-specific P210 protein is the product of the bcr/abl hybrid gene. Science, 233, 212–214. - PubMed
    1. Wada H., Mizutani,S., Nishimura,J., Usuki,Y., Kohsaki,M., Komai,M., Kaneko,H., Sakamoto,S., Delia,D. and Kanamaru,A. (1995) Establishment and molecular characterization of a novel leukemic cell line with Philadelphia chromosome expressing p230 BCR/ABL fusion protein. Cancer Res., 55, 3192–3196. - PubMed
    1. Lugo T.G., Pendergast,A.M., Muller,A.J. and Witte,O.N. (1990) Tyrosine kinase activity and transformation potency of bcr/abl oncogene products. Science, 256, 836–839. - PubMed
    1. Daley G.Q. and Baltimore,D. (1988) Transformation of an interleukin- 3-dependent hematopoietic cell line by the chronic myelogenous leukemia-specific P210 bcr/abl proteins. Proc. Natl Acad. Sci. USA, 85, 9312–9316. - PMC - PubMed

Publication types

MeSH terms

Associated data