Comparative analysis of the gene-dense ACHE/TFR2 region on human chromosome 7q22 with the orthologous region on mouse chromosome 5
- PMID: 11239002
- PMCID: PMC29746
- DOI: 10.1093/nar/29.6.1352
Comparative analysis of the gene-dense ACHE/TFR2 region on human chromosome 7q22 with the orthologous region on mouse chromosome 5
Abstract
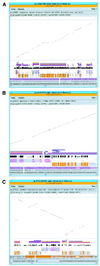
Chromosome 7q22 has been the focus of many cytogenetic and molecular studies aimed at delineating regions commonly deleted in myeloid leukemias and myelodysplastic syndromes. We have compared a gene-dense, GC-rich sub-region of 7q22 with the orthologous region on mouse chromosome 5. A physical map of 640 kb of genomic DNA from mouse chromosome 5 was derived from a series of overlapping bacterial artificial chromosomes. A 296 kb segment from the physical map, spanning ACHE: to Tfr2, was compared with 267 kb of human sequence. We identified a conserved linkage of 12 genes including an open reading frame flanked by ACHE: and Asr2, a novel cation-chloride cotransporter interacting protein Cip1, Ephb4, Zan and Perq1. While some of these genes have been previously described, in each case we present new data derived from our comparative sequence analysis. Adjacent unfinished sequence data from the mouse contains an orthologous block of 10 additional genes including three novel cDNA sequences that we subsequently mapped to human 7q22. Methods for displaying comparative genomic information, including unfinished sequence data, are becoming increasingly important. We supplement our printed comparative analysis with a new, Web-based program called Laj (local alignments with java). Laj provides interactive access to archived pairwise sequence alignments via the WWW. It displays synchronized views of a dot-plot, a percent identity plot, a nucleotide-level local alignment and a variety of relevant annotations. Our mouse-human comparison can be viewed at http://web.uvic.ca/~bioweb/laj.html. Laj is available at http://bio.cse.psu.edu/, along with online documentation and additional examples of annotated genomic regions.
Figures


Similar articles
-
Generation and comparative analysis of approximately 3.3 Mb of mouse genomic sequence orthologous to the region of human chromosome 7q11.23 implicated in Williams syndrome.Genome Res. 2002 Jan;12(1):3-15. doi: 10.1101/gr.214802. Genome Res. 2002. PMID: 11779826 Free PMC article.
-
Fine-scale comparative mapping of the human 7q11.23 region and the orthologous region on mouse chromosome 5G: the low-copy repeats that flank the Williams-Beuren syndrome deletion arose at breakpoint sites of an evolutionary inversion(s).Genomics. 2000 Oct 1;69(1):1-13. doi: 10.1006/geno.2000.6312. Genomics. 2000. PMID: 11013070
-
Comparative genomic sequencing reveals a strikingly similar architecture of a conserved syntenic region on human chromosome 11p15.3 (including gene ST5) and mouse chromosome 7.Cytogenet Cell Genet. 2001;93(3-4):284-90. doi: 10.1159/000056999. Cytogenet Cell Genet. 2001. PMID: 11528127
-
Genetic, physical, and comparative map of the subtelomeric region of mouse Chromosome 4.Mamm Genome. 2002 Jan;13(1):5-19. doi: 10.1007/s0033501-2109-8. Mamm Genome. 2002. PMID: 11773963 Free PMC article. Review.
-
Comparative genome mapping in the sequence-based era: early experience with human chromosome 7.Genome Res. 2000 May;10(5):624-33. doi: 10.1101/gr.10.5.624. Genome Res. 2000. PMID: 10810084 Free PMC article. Review.
Cited by
-
ARS2 is a conserved eukaryotic gene essential for early mammalian development.Mol Cell Biol. 2008 Mar;28(5):1503-14. doi: 10.1128/MCB.01565-07. Epub 2007 Dec 17. Mol Cell Biol. 2008. PMID: 18086880 Free PMC article.
-
LL5beta: a regulator of postsynaptic differentiation identified in a screen for synaptically enriched transcripts at the neuromuscular junction.J Cell Biol. 2005 Apr 25;169(2):355-66. doi: 10.1083/jcb.200411012. J Cell Biol. 2005. PMID: 15851520 Free PMC article.
-
CGAS: comparative genomic analysis server.Bioinformatics. 2009 Apr 1;25(7):958-9. doi: 10.1093/bioinformatics/btp086. Epub 2009 Feb 13. Bioinformatics. 2009. PMID: 19218352 Free PMC article.
-
Improvements to GALA and dbERGE II: databases featuring genomic sequence alignment, annotation and experimental results.Nucleic Acids Res. 2005 Jan 1;33(Database issue):D466-70. doi: 10.1093/nar/gki045. Nucleic Acids Res. 2005. PMID: 15608239 Free PMC article.
-
Zonadhesin D3-polypeptides vary among species but are similar in Equus species capable of interbreeding.Biol Reprod. 2010 Feb;82(2):413-21. doi: 10.1095/biolreprod.109.077891. Epub 2009 Sep 30. Biol Reprod. 2010. PMID: 19794156 Free PMC article.
References
-
- Johnson E.J., Scherer,S.W., Osborne,L., Tsui,L.C., Oscier,D., Mould,S. and Cotter,F.E. (1996) Molecular definition of a narrow interval at 7q22.1 associated with myelodysplasia. Blood, 87, 3579–3586. - PubMed
-
- Le Beau M.M., Espinosa,R.,III, Davis,E.M., Eisenbart,J.D., Larson,R.A. and Green,E.D. (1996) Cytogenetic and molecular delineation of a region of chromosome 7 commonly deleted in malignant myeloid diseases. Blood, 88, 1930–1935. - PubMed
-
- Fischer K., Frohling,S., Scherer,S.W., McAllister Brown,J., Scholl,C., Stilgenbauer,S., Tsui,L.C., Lichter,P. and Dohner,H. (1997) Molecular cytogenetic delineation of deletions and translocations involving chromosome band 7q22 in myeloid leukemias. Blood, 89, 2036–2041. - PubMed
-
- Fischer K., Brown,J., Scherer,S.W., Schramm,P., Stewart,J., Fugazza,G., Pascheberg,U., Peter,W., Tsui,L.C., Lichter,P. and Dohner,H. (1998) Delineation of genomic regions in chromosome band 7q22 commonly deleted in myeloid leukemias. Recent Results Cancer Res., 144, 46–52. - PubMed
Publication types
MeSH terms
Substances
Associated data
- Actions
- Actions
Grants and funding
LinkOut - more resources
Full Text Sources
Molecular Biology Databases
Research Materials
Miscellaneous

