Comparative Study
. 2001 Mar;125(3):1325-41.
doi: 10.1104/pp.125.3.1325.

Toward integration of comparative genetic, physical, diversity, and cytomolecular maps for grasses and grains, using the sorghum genome as a foundation

Affiliations
Comparative Study

Toward integration of comparative genetic, physical, diversity, and cytomolecular maps for grasses and grains, using the sorghum genome as a foundation

X Draye et al. Plant Physiol. 2001 Mar.

Abstract

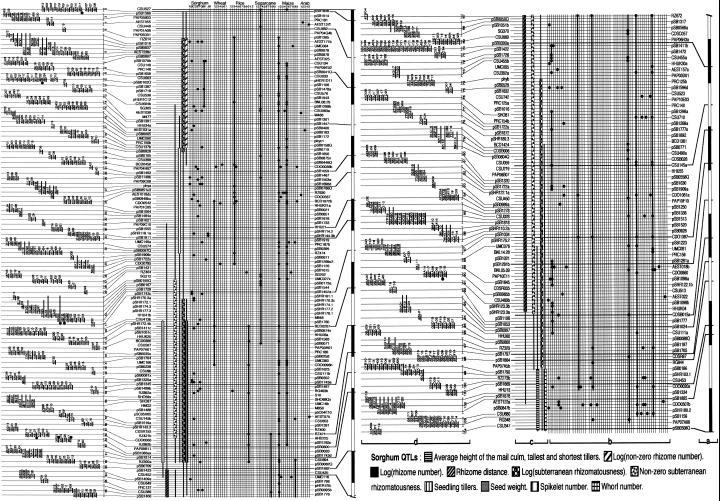
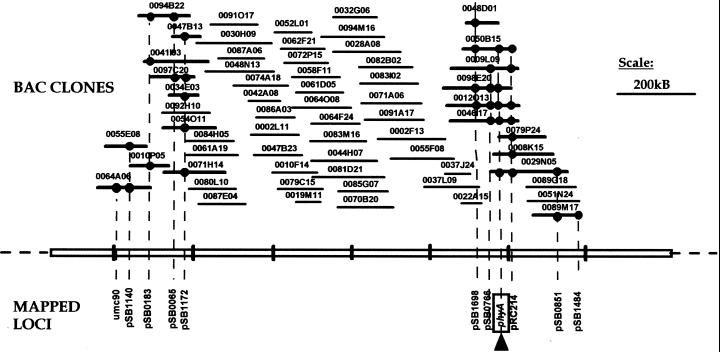
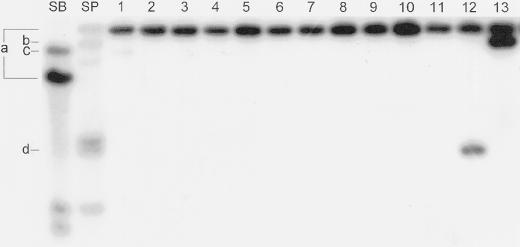
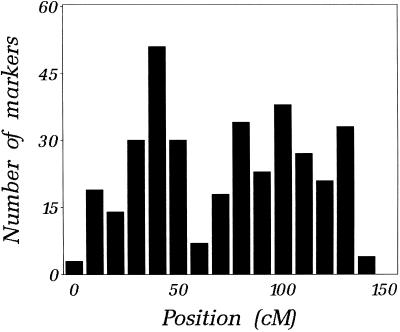
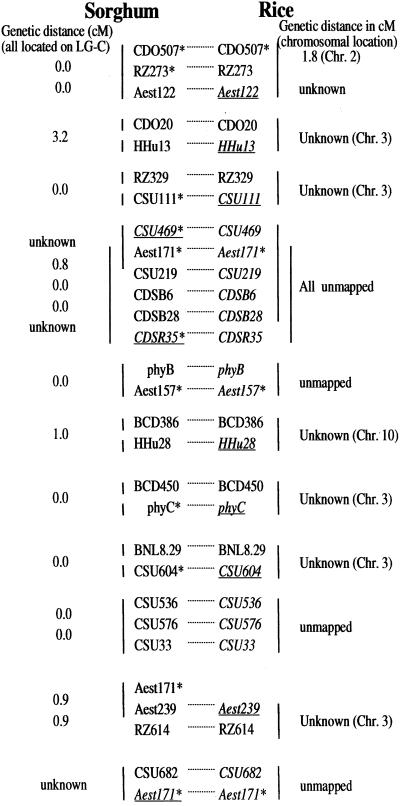
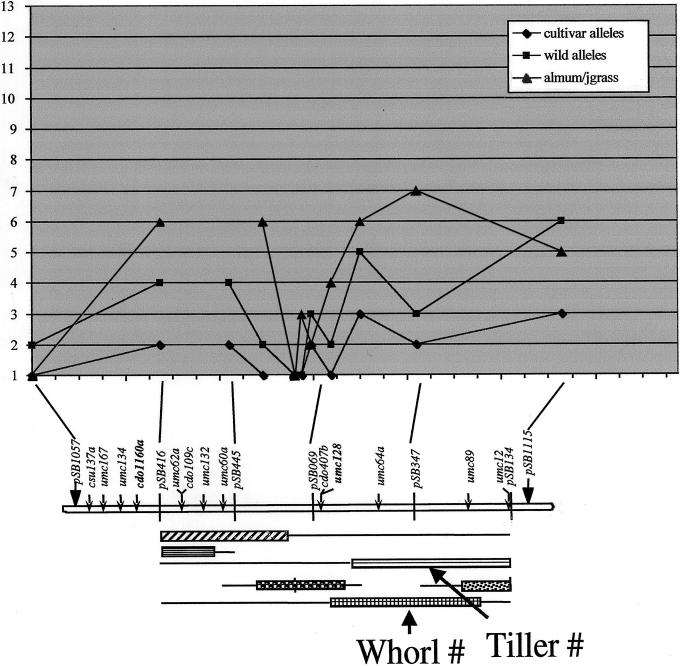
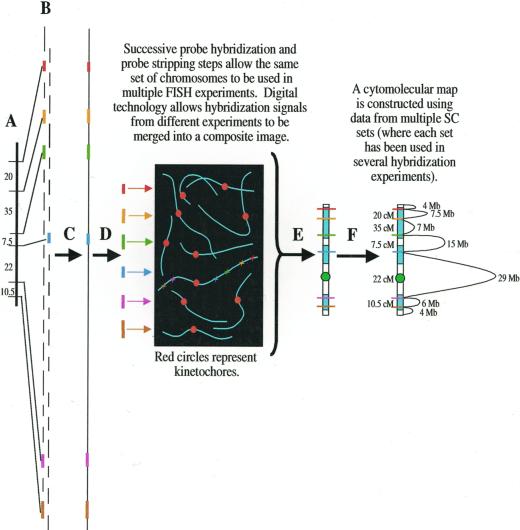
The small genome of sorghum (Sorghum bicolor L. Moench.) provides an important template for study of closely related large-genome crops such as maize (Zea mays) and sugarcane (Saccharum spp.), and is a logical complement to distantly related rice (Oryza sativa) as a "grass genome model." Using a high-density RFLP map as a framework, a robust physical map of sorghum is being assembled by integrating hybridization and fingerprint data with comparative data from related taxa such as rice and using new methods to resolve genomic duplications into locus-specific groups. By taking advantage of allelic variation revealed by heterologous probes, the positions of corresponding loci on the wheat (Triticum aestivum), rice, maize, sugarcane, and Arabidopsis genomes are being interpolated on the sorghum physical map. Bacterial artificial chromosomes for the small genome of rice are shown to close several gaps in the sorghum contigs; the emerging rice physical map and assembled sequence will further accelerate progress. An important motivation for developing genomic tools is to relate molecular level variation to phenotypic diversity. "Diversity maps," which depict the levels and patterns of variation in different gene pools, shed light on relationships of allelic diversity with chromosome organization, and suggest possible locations of genomic regions that are under selection due to major gene effects (some of which may be revealed by quantitative trait locus mapping). Both physical maps and diversity maps suggest interesting features that may be integrally related to the chromosomal context of DNA-progress in cytology promises to provide a means to elucidate such relationships. We seek to provide a detailed picture of the structure, function, and evolution of the genome of sorghum and its relatives, together with molecular tools such as locus-specific sequence-tagged site DNA markers and bacterial artificial chromosome contigs that will have enduring value for many aspects of genome analysis.


Figures

Figure 1
Figure 1
Aligned genetic, comparative, QTL, and BAC contig maps of sorghum linkage group (LG) C. The foundation for this figure is the full set of LG C loci that had been genetically mapped at the time it was made (in staggered rows). A total of 11 additional loci were detected by hybridization of these probes to the BACs but had not been genetically mapped due to lack of DNA polymorphism, and have been added to the figure based on cohybridization of mapped probes to the same BACs. a, Framework genetic map (28 loci, bar = 5cM). b, Comparative data; duplicated and/or heterologous loci in the sorghum, wheat, rice, sugarcane, maize, and Arabidopsis genomes are shown by black circles. LGs (sorghum; Chittenden et al., 1994), homoeologous groups (sugarcane; Ming et al., 1998), or chromosomes are indicated at top. Thick lines mark virtually uninterrupted sequences of such loci. In the case of sorghum, only duplicated loci are shown, not the original locus c, QTL map. Stars indicate the positions of sugarcane QTLs, whereas bars and lines show 1 and 2 log-of-odds ratio likelihood support intervals for sorghum QTLs. d, Contig map. The relative position of markers on BAC contigs are indicated by horizontal lines. Contigs are connected to the master list by their most informative marker. Black circles mark BACs that contain a copy of the pSB0880 repetitive sequence. Contig numbers (in order along the chromosome) are indicated to the right of the BACs.
Figure 2
Figure 2
Integrated physical and genetic map near phytochrome A (phy A, indicated by box and arrow) gene of sorghum. Contig 125 is approximately 1.2 MB and 5.5 cM, and consists of 63 BAC clones. A total of 11 loci were ordered into the contig based on direct and overgo hybridization, FPC fingerprint analysis (cutoff = 10−12 and tolerance = 7), and genetic mapping. Direct BAC hits are shown as black circles and connected to each locus by dashed line. Sizes (in kB) of each BAC clone are drawn to scale. Tick marks on the contig backbone represent 200 kB.
Figure 3
Figure 3
BACRF analysis of pSB1742-hybridizing BACs. The sorghum genomic clone pSB1742 detects RFLPs that map to LGs B (allele pair indicated by a, one of which comigrates with BAC vector), C (single band designated b in SP), and G (single band designated c in SB), as well as several bands that could not be mapped (such as d). Lanes 1 through 13 are HindIII digests of pooled BAC DNA extracted from 384 clones each, according to Lin et al. (2000). The pSB1742b locus on LG C corresponds to a BAC in pool 13, proven by dot blots (not shown) to be BAC 13I24. A second BAC in pool 12 (12A22) corresponded to an unmapped locus. Other corresponding BACs are not shown.
Figure 4
Figure 4
Density of DNA marker loci (RFLPs) along Sorghum LG C. The number of RFLP loci mapped in each consecutive 10-cM interval along the LG is plotted.
Figure 5
Figure 5
Comparative physical mapping of rice and sorghum. Vertical lines to left of sorghum loci and to right of rice loci indicate the sets of closely linked loci that colocate on one or more BAC clones in each species. Loci in italics are previously genetically unmapped; the subset in underlined italic font are physically linked to a mapped locus, so now it can be located on the integrated genetic physical map. For genetically mapped loci, genetic distances in centimorgans are indicated to left (sorghum) or right (rice). An asterisk shows multilocus probes that hybridize to additional loci in addition to the locus shown.
Figure 6
Figure 6
Diversity map for LG G. The nature of each gene pool is described in the text. The total number of alleles in each gene pool, at each locus, has been plotted at the chromosomal location of each locus, and data for different gene pools has been coded (see inset). QTL data plotted along the map is from a population of 370 individuals from the same F1 plant that was used to make the primary linkage map, as previously described (Lin et al., 1995; Paterson et al., 1995a, 1995b).
Figure 7
Figure 7
SCs of SB. A through D, Silver-stained SC spreads. All photographs show bright-field images except where noted. A, Partial set of SCs in which kinetochores (arrows) are readily visible. B and C, Complete SC sets. In B, one SC contains a region of incomplete synapsis (arrow), whereas in C one SC appears to be broken into two pieces (arrow). In B and C, the sixth longest SC is associated with an amorphous structure of unknown origin (large arrowheads). These structures, most readily visualized by phase-contrast microscopy (see insets of B and C), may be part of the nuclear scaffold. In D, the longest chromosome appears to be associated with remnants of the nucleolus (large arrowheads). Although the dark oval object near the bottom of this bright-field image (arrow) looks like it could be a cellular structure, examination of this SC set by phase-contrast microscopy (photo not shown) suggests that the object is a small piece of glass. Scale bar = 10 μm.
Figure 8
Figure 8
Using cytomolecular markers to anchor the physical map for a particular LG onto the actual structure of its pachytene chromosome. A, RFLP markers in the same LG are obtained via molecular mapping. B, Molecular markers are used to screen a BAC library. Positive BAC clones (colored lines) are isolated. C, A physical map of the LG is assembled. D, Insert DNA from BAC clones associated with particular linkage markers is used in FISH to SC spreads in which individual SCs and heterochromatin/euchromatin can be differentiated. The precise location(s) of each locus is determined. E, A cytomolecular map is constructed for the chromosome. In this example, heterochromatic regions are white, euchromatic regions are blue, and the kinetochore is represented by a red circle. F, The linkage map and physical map of the chromosome are superimposed directly onto the structure of the SC to produce a “cytophysical” map. Cytophysical mapping allows comparison of genetic linkage, chromatin configuration, and base pair distances.

References

    1. Agrama HAS, Moussa ME. Mapping QTLs in breeding for drought tolerance in maize (Zea mays L.) Euphytica. 1996;91:89–97.
    1. Alpert KB, Tanksley SD. High-resolution mapping and isolation of a yeast artificial chromosome contig containing fw2.2: a major fruit weight quantitative trait locus in tomato. Proc Natl Acad Sci USA. 1996;93:15503–15507. - PMC - PubMed
    1. Annen F, Chang JL, Paterson AH, Stockhaus J. Characterization of 14 different putative protein kinase cDNA clones of the C-4 plant Sorghum bicolor. Mol Gen Genet. 1998;259:115–122. - PubMed
    1. Arumunganathan K, Earle ED. Nuclear DNA content of some important plant species. Plant Mol Biol Rep. 1991;9:208–219.
    1. Austin DF, Lee M. Comparative mapping in F-2:3 and F-6:7 generations of quantitative trait loci for grain yield and yield components in maize. Theor Appl Genet. 1996a;92:817–826. - PubMed

Publication types

LinkOut - more resources