. 2001 Mar 15;21(6):1893-901.
doi: 10.1523/JNEUROSCI.21-06-01893.2001.

Mitochondria control ampa/kainate receptor-induced cytoplasmic calcium deregulation in rat cerebellar granule cells

Affiliations

Mitochondria control ampa/kainate receptor-induced cytoplasmic calcium deregulation in rat cerebellar granule cells

A C Rego et al. J Neurosci. .

Abstract

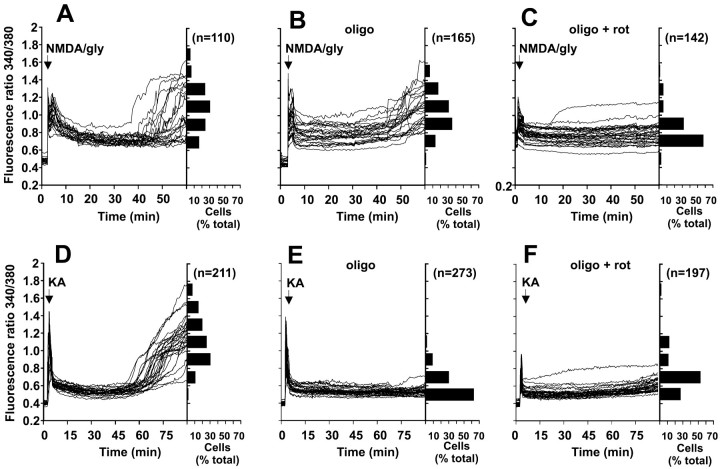
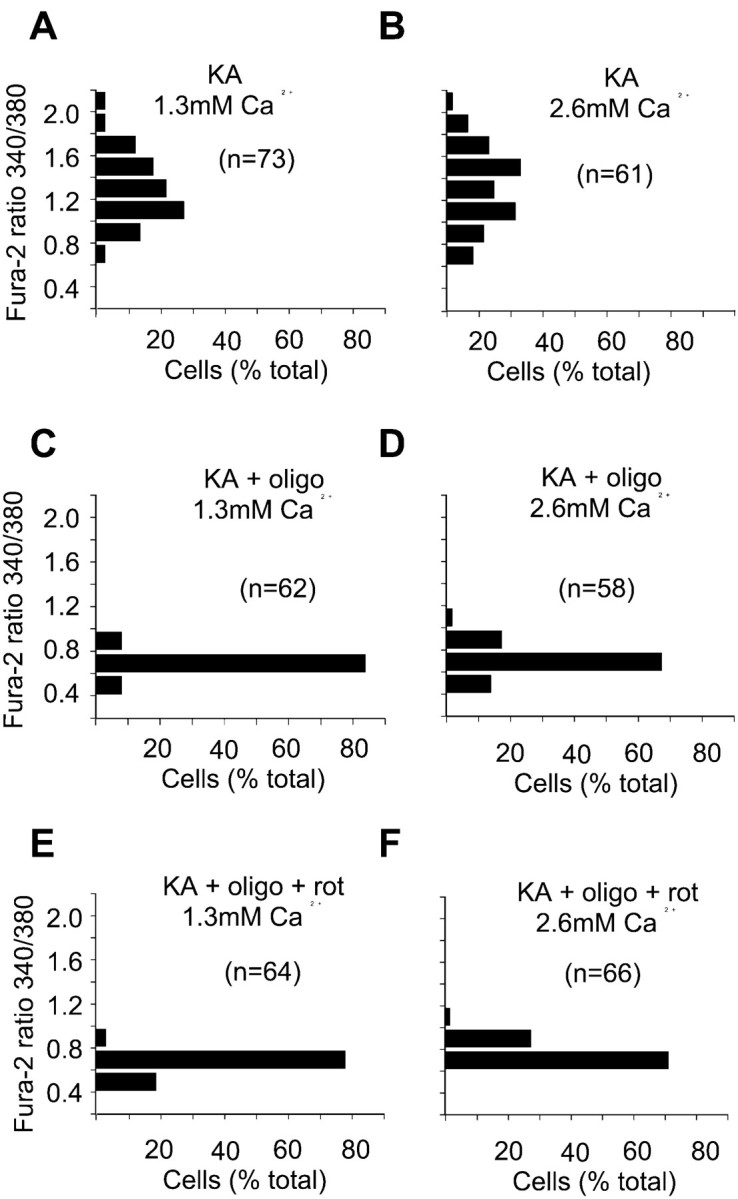
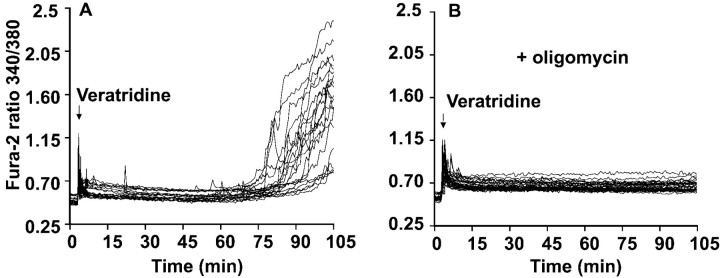
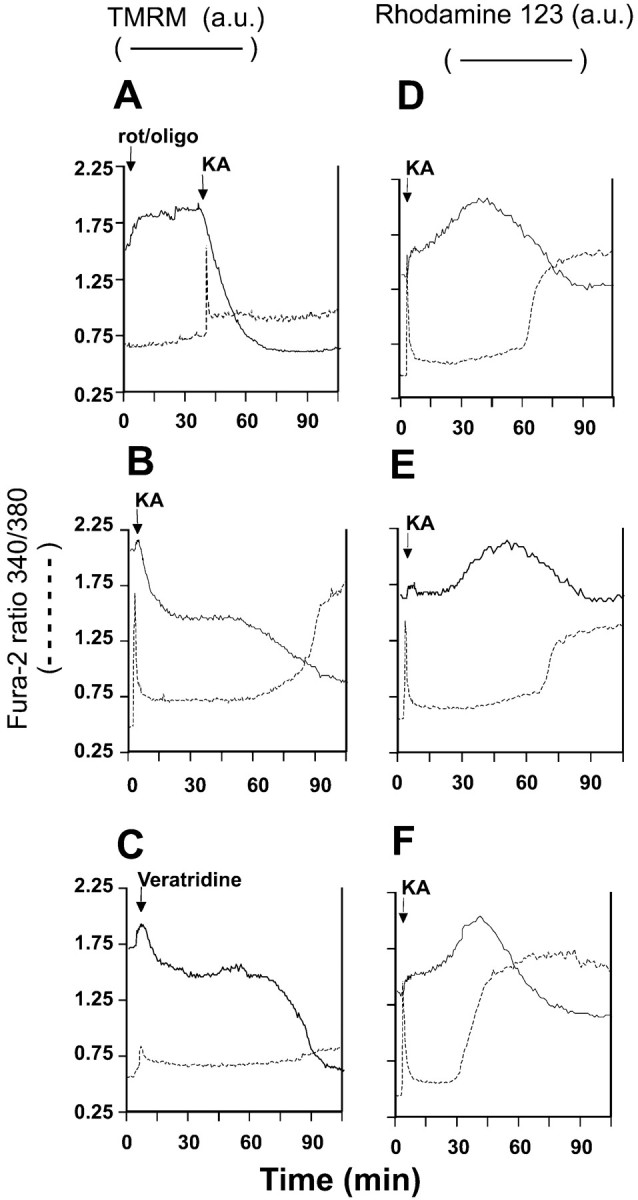
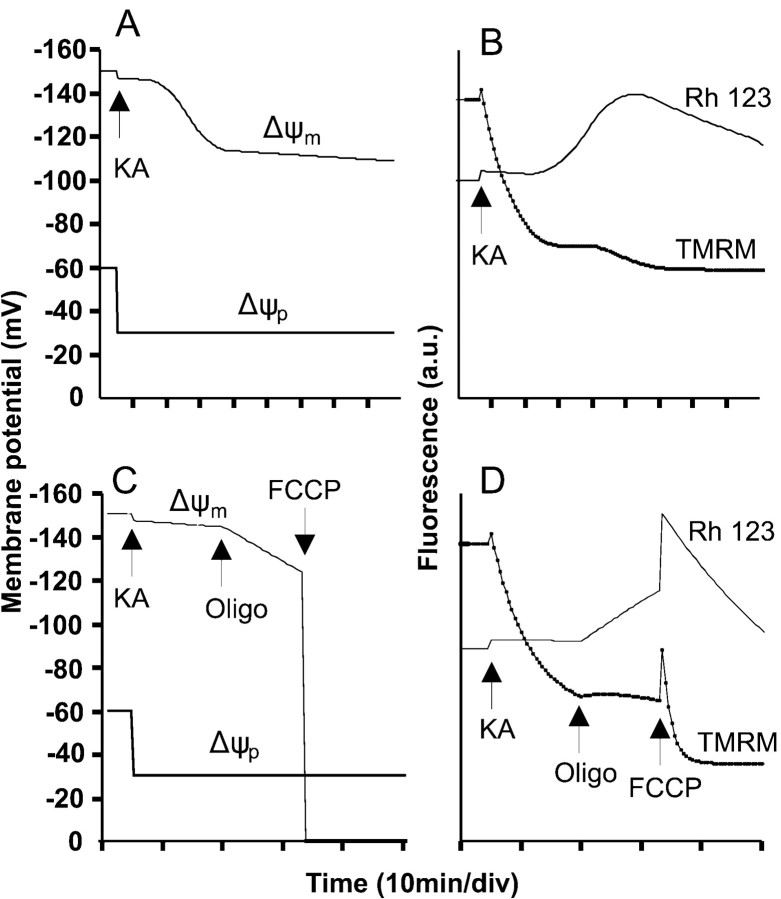
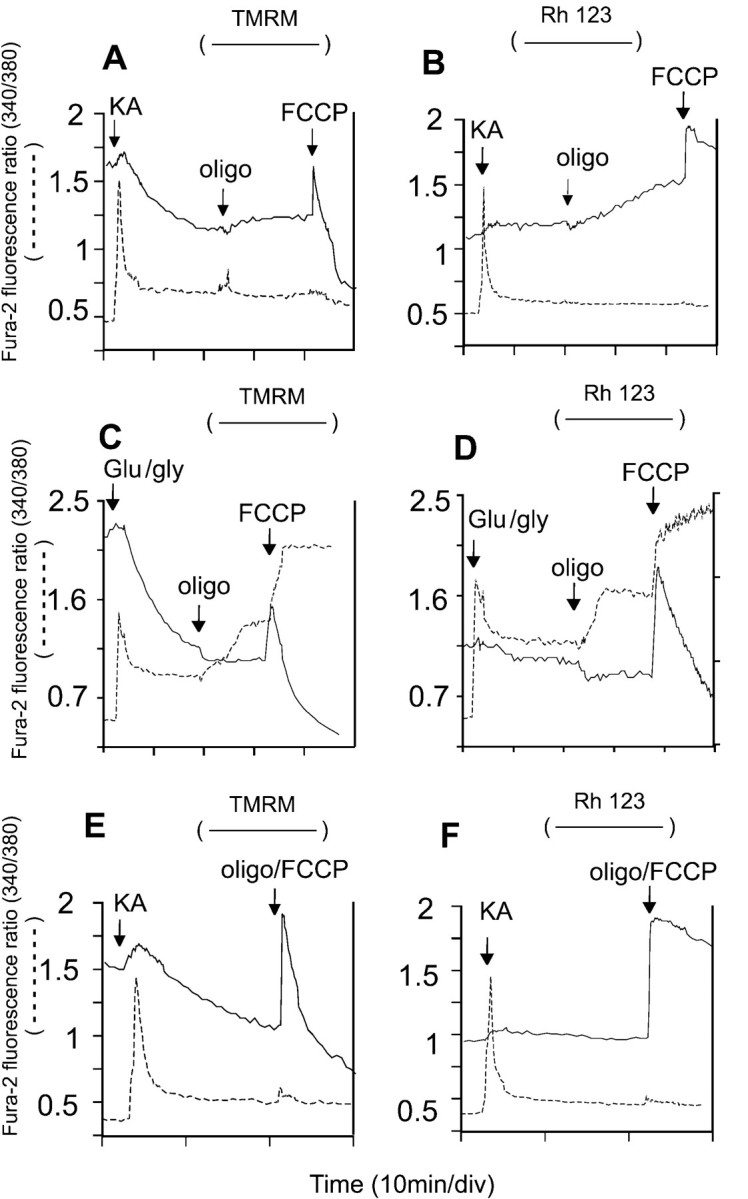
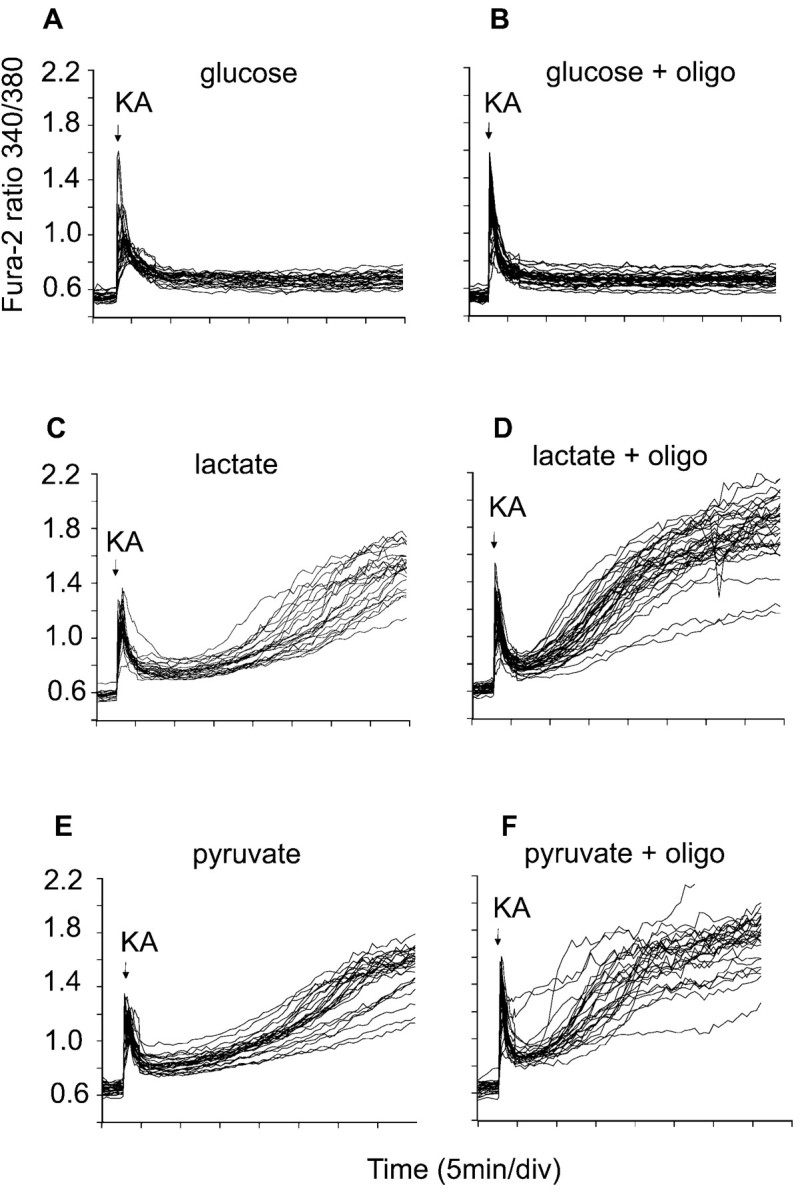
Although mitochondria mediate the delayed failure of cytoplasmic Ca(2+) homeostasis [delayed Ca(2+) deregulation (DCD)] in rat cerebellar granule cells resulting from chronic activation of NMDA receptors, their role in AMPA/KA-induced DCD remains to be established. The mitochondrial ATP synthase inhibitor oligomycin protected cells against KA- but not NMDA-evoked DCD. In contrast to NMDA-evoked DCD, no additional protection was afforded by the further addition of rotenone. The effects of KA on cytoplasmic Ca(2+) homeostasis, including the protection afforded by oligomycin, could be reproduced by veratridine. KA exposure induced a partial mitochondrial depolarization that was enhanced by oligomycin, indicating ATP synthase reversal. The nonglycolytic substrates pyruvate and lactate were unable to maintain Ca(2+) homeostasis in the presence of KA. In contrast to NMDA, KA exposure did not cause mitochondrial Ca(2+) loading. The data indicate that Na(+) entry via noninactivating AMPA/KA receptors or voltage-activated Na(+) channels compromises mitochondrial function sufficiently to cause ATP synthase reversal. Oligomycin may protect by preventing the consequent mitochondrial drain of cytoplasmic ATP.


Figures

Fig. 1.
Fig. 1.
Effect of mitochondrial inhibitors on delayed Ca2+ deregulation induced by NMDA plus glycine or by KA. A–C, Cells loaded with fura-2 were incubated in Mg2+-free medium containing 10 μmNBQX. Where indicated, the cells were stimulated with 100 μm NMDA plus 10 μm glycine.D–F, Cells were incubated in medium containing Mg2+ and 2 μm MK-801 and were stimulated with 100 μm KA. Experiments were performed in the absence of mitochondrial inhibitors (A, D) or in the presence of 5 μg/ml oligomycin (B, E) or 5 μg/ml oligomycin plus 2 μm rotenone (C, F). The inhibitors were added 5 min before the addition of the receptor agonists. Each figure shows traces from 23 to 34 somata. The frequency histograms indicate the range of fluorescence ratios observed in somata at the end of each experiment (60 min for NMDA and glycine and 90 min for KA). Data shown in each histogram are from at least four independent experiments and the indicated number of cells. gly, Glycine;oligo, oligomycin; rot, rotenone.
Fig. 2.
Fig. 2.
Elevated external Ca2+ does not affect KA-induced delayed Ca2+ deregulation. Cells were loaded with fura-2 and incubated in medium containing 1.2 mm Mg2+, 2 μm MK-801, and either 1.3 mm (A, C, E) or 2.6 mm (B, D, F) Ca2+. Experiments were performed in the absence of mitochondrial inhibitors (A, B) or in the presence of 5 μg/ml oligomycin (C, D) or oligomycin plus 2 μm rotenone (E, F). KA (100 μm) was added at least 5 min after addition of the mitochondrial inhibitors, and the frequency histograms show the 340/380 nm ratios for the indicated number of cell somata after a 90 min exposure to the agonist. Data shown in each histogram are from at least three independent experiments.
Fig. 3.
Fig. 3.
Veratridine induction of oligomycin-sensitive delayed Ca2+ deregulation. Cells were incubated in medium containing 2 μm MK-801 and 10 μmNBQX, in the absence (A) or in the presence (B) of 5 μg/ml oligomycin added 5 min before the addition of 10 μm veratridine. In parallel experiments, KA-induced DCD was apparent by 75 min, and no KA-induced Ca2+ deregulation was seen in oligomycin-treated cells after 105 min (data not shown). Data are representative of at least 20 somata from five independent experiments.
Fig. 4.
Fig. 4.
TMRM+ and rhodamine-123 fluorescence during KA and veratridine exposure. Cells were loaded with fura-2 and either 50 nm TMRM+(A–C) or 1.3 μm rhodamine-123 (D–F) in the presence of 2 μmMK-801. The veratridine experiment additionally contained 10 μm NBQX. Where indicated, 2 μm rotenone plus 5 μg/ml oligomycin, 100 μm KA, or 10 μm veratridine was added. Each pair oftraces is from a single cell soma representative of at least 20 cells, from four to six independent experiments. Dashed traces, fura-2; solid traces, TMRM+ or rhodamine-123 fluorescence. a.u., arbitrary units.
Fig. 5.
Fig. 5.
Mathematical simulation of changes in membrane potentials that reproduce the pattern of whole-cell fluorescence in the presence of KA. A, Synthetic membrane potential profile for a cell in which KA causes an immediate plasma membrane (Δψp) depolarization because of AMPA/KA receptor activation followed by an early, partial mitochondrial (Δψm) depolarization. B, Simulated traces for rhodamine-123 and TMRM+ in the depolarization protocol inA. Note the similarity between the TMRM+trace and the actual experiment in Figure 4B and between the rhodamine-123trace and the experimental traces in Figure 4D–F. C, Synthetic membrane potential profile for a cell in which oligomycin initiates a slow depolarization after KA and FCCP collapses Δψm.D, Simulated traces for rhodamine-123 and TMRM+ in the depolarization protocol inC. Note the similarity between the TMRM+trace and an actual experiment (see Fig. 6A) and between the rhodamine-123 trace and an experiment (see Fig.6B). Rh 123, Rhodamine-123.
Fig. 6.
Fig. 6.
The use of oligomycin and FCCP to probe mitochondrial function in KA-exposed cells. Cells were loaded with fura-2 and equilibrated with 50 nm TMRM+(A, C, E) or 1.3 μm rhodamine-123 (B, D, F). The media for the KA experiments (A, B, E, F) contained additionally 2 μm MK-801, whereas C and Dcontained 10 μm NBQX. Where indicated, additions were made of 100 μm KA, 100 μm glutamate plus 10 μm glycine, 5 μg/ml oligomycin, and 2.5 μm FCCP. Note that oligomycin induced a slow depolarization of mitochondria in KA-exposed cells (A, B) but hyperpolarized mitochondria in NMDA-exposed cells (C, D) and that FCCP and oligomycin failed to release Ca2+ from mitochondria into the cytoplasm (E, F). Each pair of traces is from a single soma representative of at least 20 cells from four to six independent experiments.
Fig. 7.
Fig. 7.
Cytoplasmic Ca2+ homeostasis in cells maintained by nonglycolytic substrates. The cells were loaded with fura-2 and incubated in the presence of 15 mm glucose (A, B) or in glucose-free medium containing 2 μm MK-801, 2 mm 2-deoxyglucose, and 10 mml-lactate or 10 mm pyruvate (C–F). KA (100 μm) was added where indicated. In tracesB, D, andF, 5 μg/ml oligomycin was present from the beginning of the experiment. Data are representative of at least 20 somata from four independent experiments.

References

    1. Bindokas VP, Miller RJ. Excitotoxic degeneration is initiated at non-random sites in cultured rat cerebellar neurons. J Neurosci. 1995;15:6999–7011. - PMC - PubMed
    1. Brorson JR, Manzolillo PA, Miller RJ. Ca entry via AMPA/KA receptors and excitotoxicity in cultured cerebellar Purkinje cells. J Neurosci. 1994;14:187–197. - PMC - PubMed
    1. Budd SL, Nicholls DG. A re-evaluation of the role of mitochondria in neuronal calcium homeostasis. J Neurochem. 1996a;66:403–411. - PubMed
    1. Budd SL, Nicholls DG. Mitochondrial calcium regulation and acute glutamate excitotoxicity in cultured cerebellar granule cells. J Neurochem. 1996b;67:2282–2291. - PubMed
    1. Bunting JR. Influx and efflux kinetics of cationic dye binding to respiring mitochondria. Biophys Chem. 1992;42:163–175. - PubMed

Publication types

MeSH terms

LinkOut - more resources