. 2001 Mar 15;21(6):1931-8.
doi: 10.1523/JNEUROSCI.21-06-01931.2001.

Delayed neurodegeneration in neonatal rat thalamus after hypoxia-ischemia is apoptosis

Affiliations

Delayed neurodegeneration in neonatal rat thalamus after hypoxia-ischemia is apoptosis

F J Northington et al. J Neurosci. .

Abstract

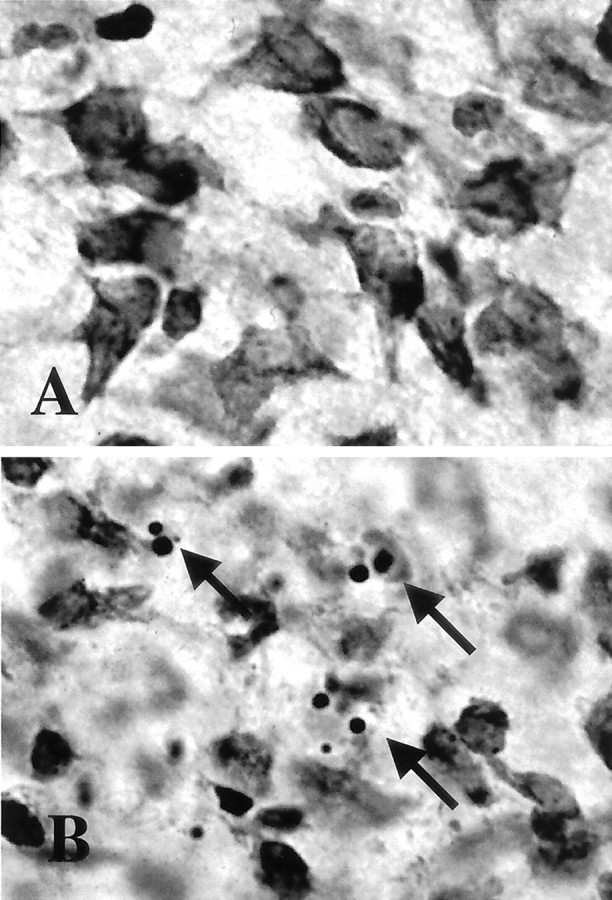
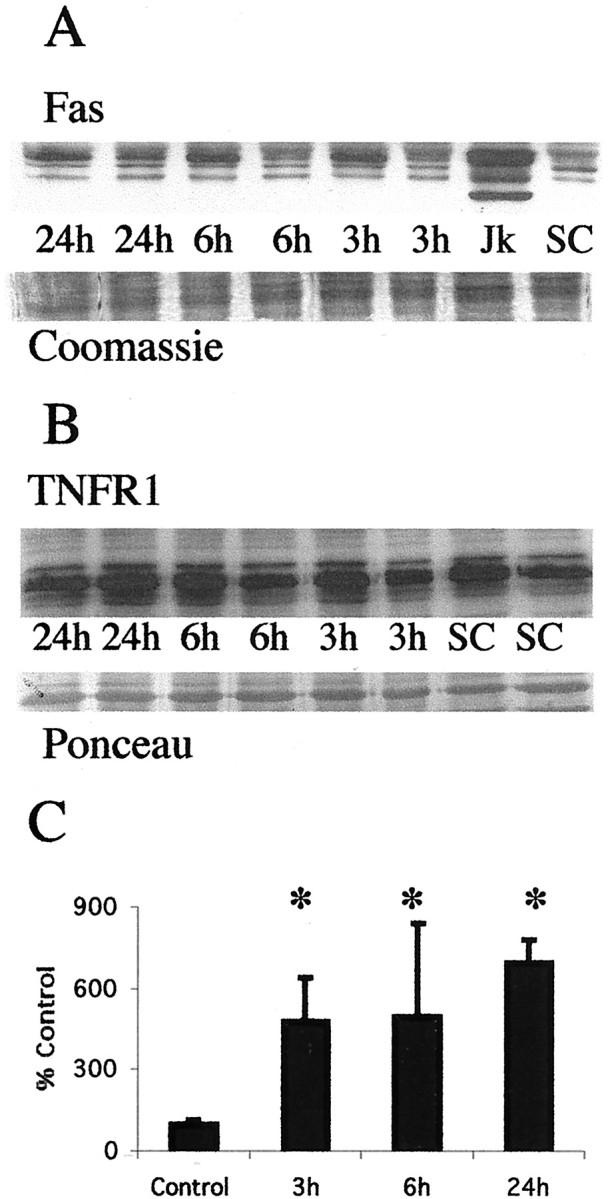
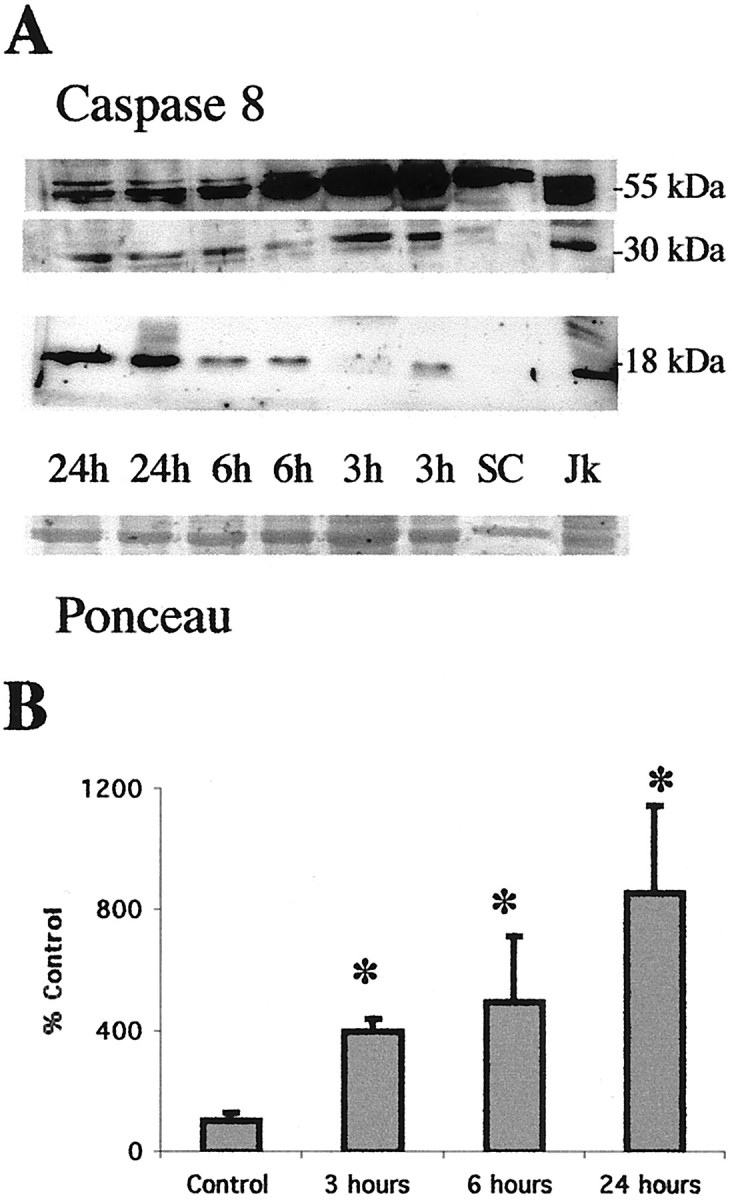
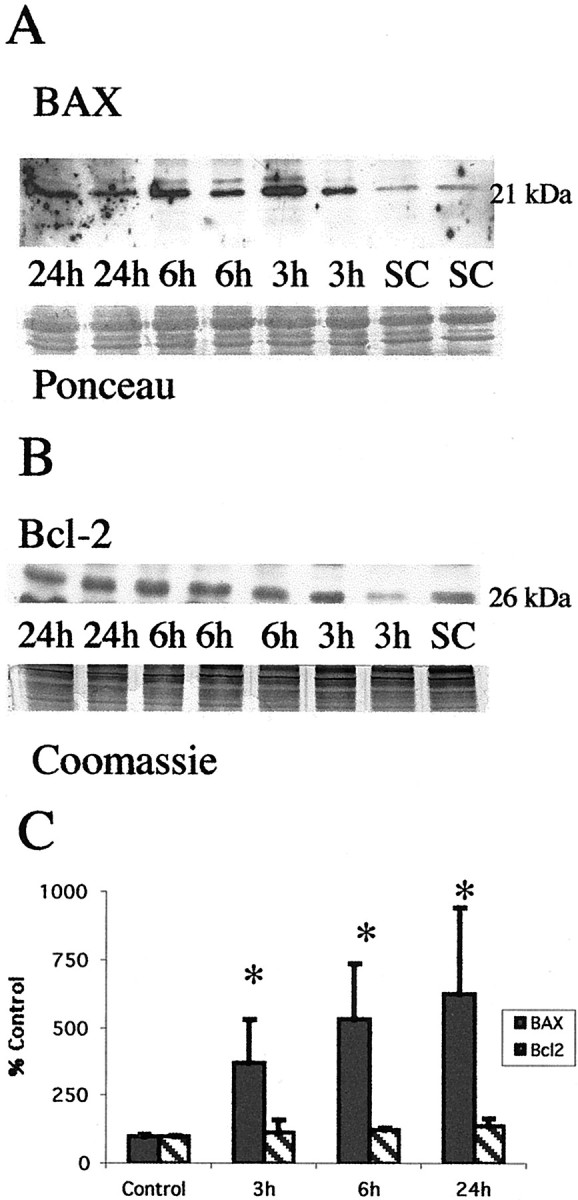
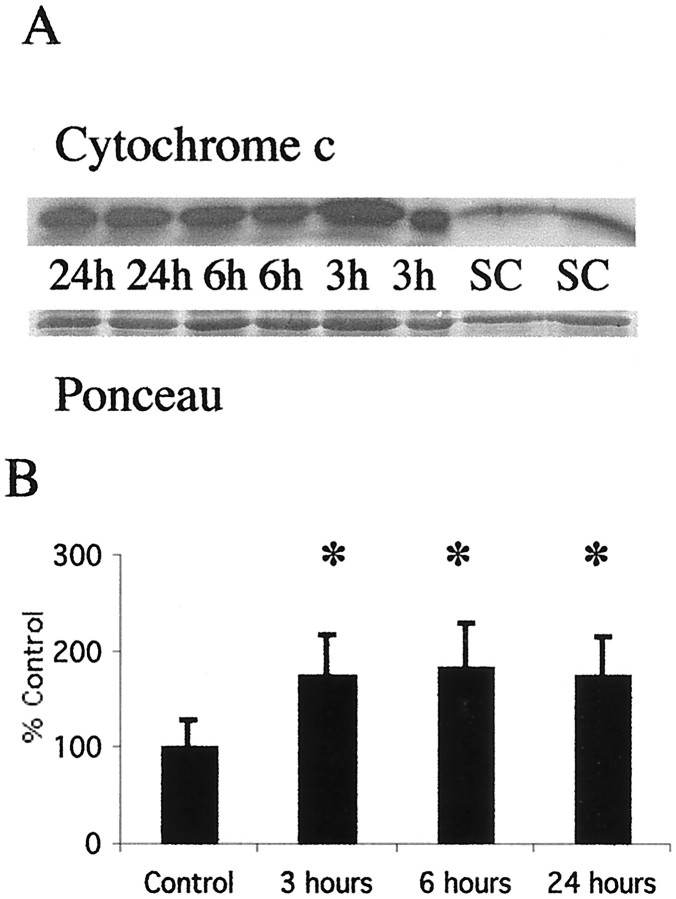
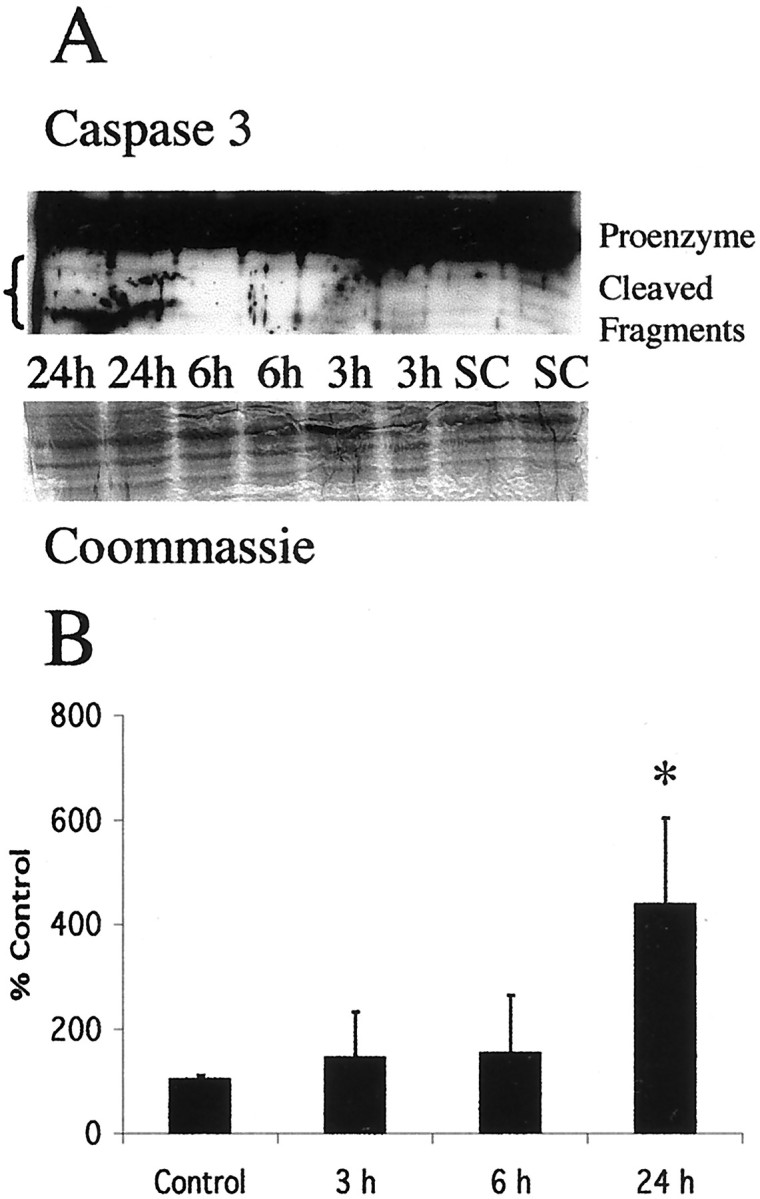
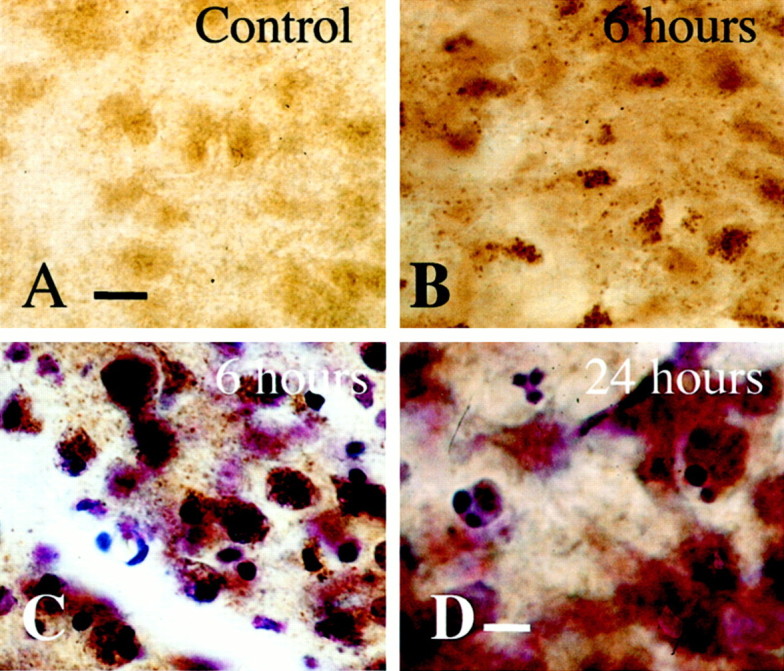
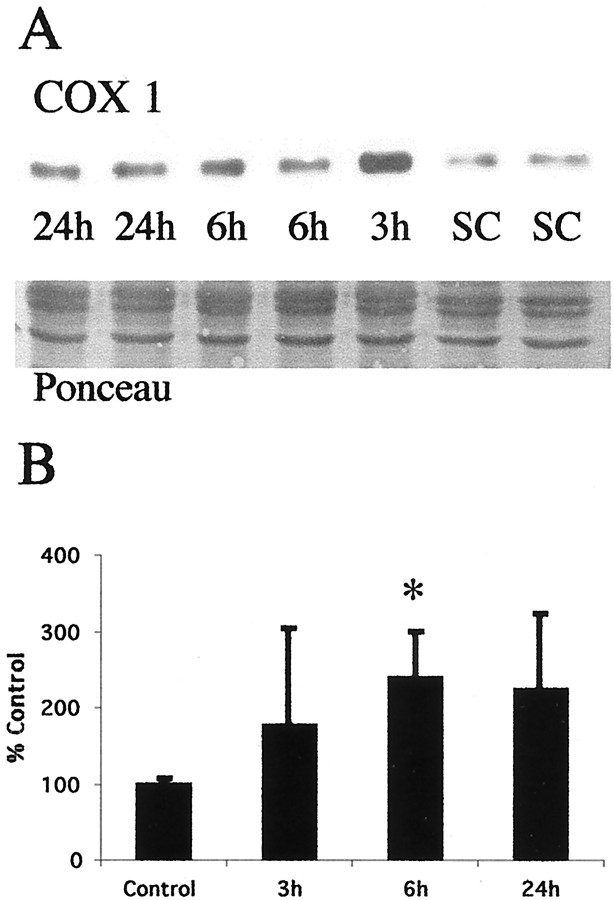
Brain injury in newborns can cause deficits in motor and sensory function. In most models of neonatal brain injury, thalamic damage often occurs. Using the Rice-Vannucci model of neonatal hypoxic-ischemic brain injury, we have shown that neuronal degeneration in somatosensory thalamus is delayed in onset ( approximately 24 hr) compared with cortical and striatal injury and exhibits prominent structural features of apoptosis. In the present study, we examined whether cell death in the thalamus has molecular features of apoptosis. Fas death receptor protein expression increased rapidly after neonatal hypoxia-ischemia, in concert with cleavage of procaspase 8 to its active form. Concurrently, the levels of Bax in mitochondrial-enriched cell fractions increase, and cytochrome c accumulates in the soluble fraction. Mitochondria accumulate in a perinuclear distribution by 6 hr after hypoxia-ischemia. Cytochrome oxidase subunit 1 protein levels also increase at 6 hr after hypoxia-ischemia. Increased levels of Fas death receptor, Bax, and cytochrome c, activation of caspase 8, and abnormalities in mitochondria in the thalamus significantly precede the activation of caspase 3 and the appearance of neuronal apoptosis at 24 hr. We conclude that the delayed neurodegeneration in neonatal rat ventral basal thalamus after hypoxic-ischemic injury is apoptosis mediated by death receptor activation.


Figures

Fig. 1.
Fig. 1.
Thalamic neurons die by apoptosis after neonatal hypoxia–ischemia. A, B, Compared with sham controls (A), neurons at 24 hr after hypoxia–ischemia (B) contain many apoptotic profiles as seen in cresyl violet-stained sections of the ventral basal thalamus (arrows).
Fig. 2.
Fig. 2.
Fas death receptor protein levels increase in the thalamus after neonatal hypoxia–ischemia. A, Top, Immunoblot showing increased Fas death receptor protein in membrane fractions from thalamic homogenates obtained 3, 6, and 24 hr after neonatal hypoxia–ischemia compared with noninjured control samples. Jurkat cell lysates were used as a positive control, because they express high levels of Fas as detected at 45 kDa. The corresponding 45 kDa band in controls and injured thalamic samples was used for quantification. Bottom, The corresponding Coomassie-stained gel. B, Top, Immunoblot showing no change in TNFR1 death receptor protein in membrane fractions from thalamic homogenates obtained 3, 6, and 24 hr after neonatal hypoxia–ischemia compared with noninjured control samples.Bottom, The corresponding Ponceau-stained blot. ForA and B each lanerepresents a pooled sample of thalamus from three animals at the indicated time point (i.e., sham control and 3, 6, or 24 hr after hypoxia–ischemia). C, Graph representing changes in Fas death receptor protein levels in the thalamus over time after neonatal hypoxia–ischemia. Results are shown as the mean ± SD of four to five pooled samples per time point (*p < 0.05 compared with control). Jk, Jurkat cell lysates;SC, sham control.
Fig. 3.
Fig. 3.
Procaspase 8 is cleaved to active fragments in the thalamus after neonatal hypoxia–ischemia. A, Immunoblot showing that procaspase 8 (54–55 kDa) levels decrease concurrently with an increase in the levels of the 30 and 18 kDa active fragments of caspase 8 in cytosolic fractions from the thalamus at 3, 6, and 24 hr after neonatal hypoxia–ischemia. There is a progressive increase in expression of the active subunits during the first 24 hr after hypoxia–ischemia compared with controls (SC). Anti-caspase 8 antibody also reacts strongly with a 55, 30, and 18 kDa protein in Jk cells consistent with the proenzyme and active fragment forms of caspase 8. Bottom, The corresponding Ponceau-stained blot. Each lane represents a pooled sample of thalamus from three animals at the indicated time point (i.e., sham control and 3, 6, or 24 hr after hypoxia–ischemia).B, Graph representing changes in abundance of the 18 kDa active subunit of caspase 8 in the thalamus over time after neonatal hypoxia–ischemia. After correcting for protein-loading differences and comparing with control, results are shown as the mean ± SD of four to five pooled samples per time point (*p < 0.05 compared with control).
Fig. 4.
Fig. 4.
Neonatal hypoxia–ischemia causes an elevation in proapoptosis Bax protein levels in the mitochondrial fraction but does not alter levels of antiapoptosis Bcl-2. A, Top, Immunoblot shows increased Bax protein levels in mitochondrial membrane fractions from the thalamus from homogenates obtained 3, 6, and 24 hr after neonatal hypoxia–ischemia compared with noninjured control samples (SC). Anti-Bax antibody recognizes the expected 21 kDa band corresponding to Bax protein. Bottom, The corresponding Ponceau-stained blot is shown. Each lanerepresents a pooled sample of thalamus from three animals at the indicated time point (i.e., sham control and 3, 6, or 24 hr after hypoxia–ischemia). B, In comparison Bcl-2 protein expression is not changed in mitochondrial membrane fractions from thalamus homogenates obtained 3, 6, and 24 hr after neonatal hypoxia–ischemia compared with noninjured control samples (SC). Anti-Bcl-2 antibody recognizes the expected 26 kDa band corresponding to Bcl-2 protein. Bottom, The corresponding Coomassie-stained gel is shown. C, Graph represents alteration in relative amounts of Bax and Bcl-2 protein in the mitochondrial membrane fraction in the thalamus over time after neonatal hypoxia–ischemia. By 3 hr, there is a significant shift in the Bax/Bcl-2 ratio favoring proapoptosis Bax. After correcting for protein-loading differences and comparing with control, results are shown as the mean ± SD of four to five pooled samples per time point (*p < 0.05 compared with control).
Fig. 5.
Fig. 5.
Cytochrome c accumulates in the soluble fraction in the thalamus after neonatal hypoxia–ischemia. A, Top, Immunoblot showing increased cytochrome c protein in soluble fractions from thalamic homogenates obtained 3, 6, and 24 hr after neonatal hypoxia–ischemia compared with noninjured control samples (SC). Bottom, The corresponding Ponceau-stained blot. Each lane represents a pooled sample of thalamus from three animals at the indicated time point (i.e., sham control and 3, 6, or 24 hr after hypoxia–ischemia).B, Graph showing the accumulation of cytochrome c in the thalamus over time after neonatal hypoxia–ischemia. After correcting for protein-loading differences and comparing with control, results are shown as the mean ± SD of four to five pooled samples per time point (*p < 0.05 compared with control).
Fig. 6.
Fig. 6.
Cleavage of procaspase 3 to active fragments occurs at 24 hr after neonatal hypoxia–ischemia. A, Top, Immunoblot shows levels of 32 kDa procaspase 3 and its lower molecular weight cleavage products in thalamus cytosolic fractions from homogenates obtained 3, 6, and 24 hr after neonatal hypoxia–ischemia compared with noninjured control samples (SC). Bottom, The corresponding Coomassie-stained blot is shown. Each lane represents a pooled sample of thalamus from three animals at the indicated time point (i.e., sham control and 3, 6, or 24 hr after hypoxia–ischemia).B, Graph represents change in expression of the12 kDa cleavage product in the thalamus over time after neonatal hypoxia–ischemia. Not until 24 hr is there a significant increase in the expression of the 12 kDa fragment. After correcting for protein-loading differences and comparing with control, results are shown as the mean ± SD of four to five pooled samples per time point (*p < 0.05 compared with control).
Fig. 7.
Fig. 7.
Mitochondria accumulate in a perinuclear location in ventral basal thalamic neurons after neonatal hypoxia–ischemia. Histochemistry for cytochrome oxidase activity in the thalamus after neonatal hypoxia–ischemia shows intense cytochrome oxidase activity in mitochondria and alteration in appearance and intracellular location of mitochondria after neonatal hypoxia–ischemia. At 6 hr, mitochondria are densely immunoreactive for cytochrome oxidase, assuming a punctate appearance and clustering near nuclei that are in the chromatolytic phase of apoptosis (B, C, cytochrome oxidase histochemistry and cytochrome oxidase histochemistry counterstained with cresyl violet, respectfully). By 24 hr (D), cytochrome oxidase immunoreactivity is dissipating in thalamic neurons undergoing late stages of apoptotic degeneration. Three cells with densely condensed chromatin are shown with variable but decreasing levels of cytochrome oxidase activity. Scale bars: A–C, 12 μm; D, 6 μm.
Fig. 8.
Fig. 8.
COX1 protein increases in thalamic mitochondrial protein fractions coincident with mitochondrial accumulation after neonatal hypoxia–ischemia. A, Top, Immunoblot shows an increase in COX1 protein in mitochondria-enriched membrane fractions from the thalamus from homogenates obtained 3, 6, and 24 hr after neonatal hypoxia–ischemia compared with noninjured control samples (SC). Bottom, The corresponding Ponceau-stained blot is shown. Each lane represents a pooled sample of thalamus from three animals at the indicated time point (i.e., sham control and 3, 6, or 24 hr after hypoxia–ischemia).B, Graph represents changes in COX1 protein levels in the thalamus over time after neonatal hypoxia–ischemia. The maximal increase at 6 hr corresponds nicely with the peak in mitochondrial accumulation seen at 6 hr in Figure 7C. After correcting for protein-loading differences and comparing with control, results are shown as the mean ± SD of four to five pooled samples per time point (*p < 0.05 compared with control).

References

    1. Al-Abdulla NA, Martin LJ. Apoptosis of retrogradely degenerating neurons occurs in association with the accumulation of perkaryal mitochondria and oxidative damage to the nucleus. Am J Pathol. 1998;153:447–456. - PMC - PubMed
    1. Al-Abdulla NA, Portera-Cailliau C, Martin LJ. Occipital cortex ablation in adult rat causes retrograde neuronal death in the lateral geniculate nucleus that resembles apoptosis. Neuroscience. 1998;86:191–209. - PubMed
    1. Almeida OF, Conde GL, Crochemore C, Demeneix BA, Fischer D, Hassan AH, Meyer M, Holsboer F, Michaelidis TM. Subtle shifts in the ratio between pro- and antiapoptotic molecules after activation of corticosteroid receptors decide neuronal fate. FASEB J. 2000;14:779–790. - PubMed
    1. Antonawich FJ, Federoff HJ, Davis JN. BCL-2 transduction, using a herpes simplex virus amplicon, protects hippocampal neurons from transient global ischemia. Exp Neurol. 1999;156:130–137. - PubMed
    1. Back SA, Li Y, Gan X, Rosenberg PA, Volpe JJ. Maturation-dependent vulnerability of oligodendrocytes to oxidative stress-induced death caused by glutathione depletion. J Neurosci. 1998;18:6241–6253. - PMC - PubMed

Publication types

MeSH terms