. 2001 Mar 15;21(6):2028-38.
doi: 10.1523/JNEUROSCI.21-06-02028.2001.

Regulation of microglial development: a novel role for thyroid hormone

Affiliations

Regulation of microglial development: a novel role for thyroid hormone

F R Lima et al. J Neurosci. .

Abstract

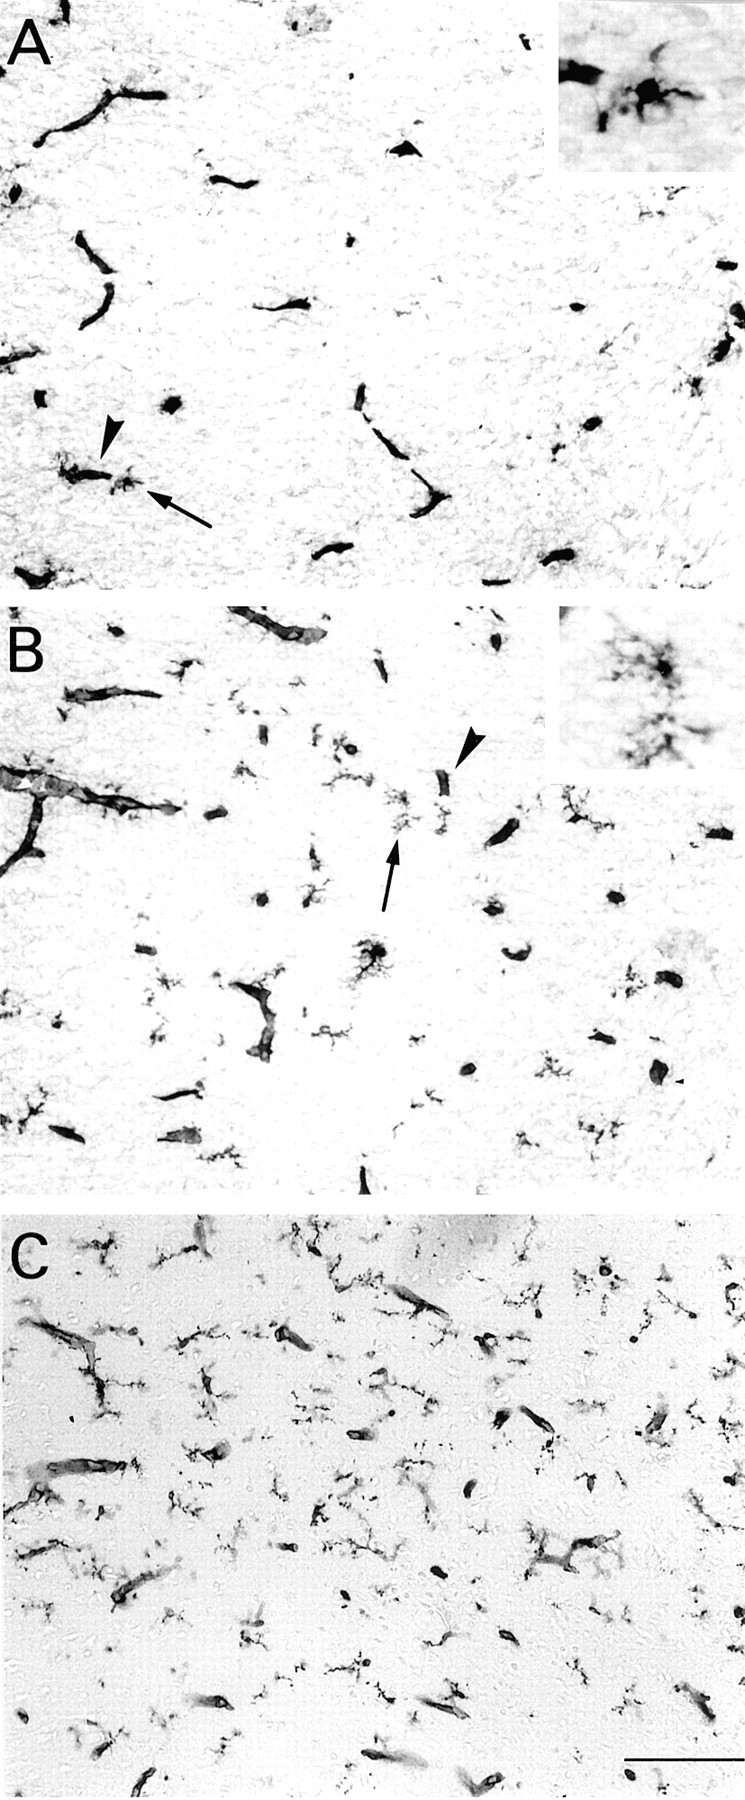
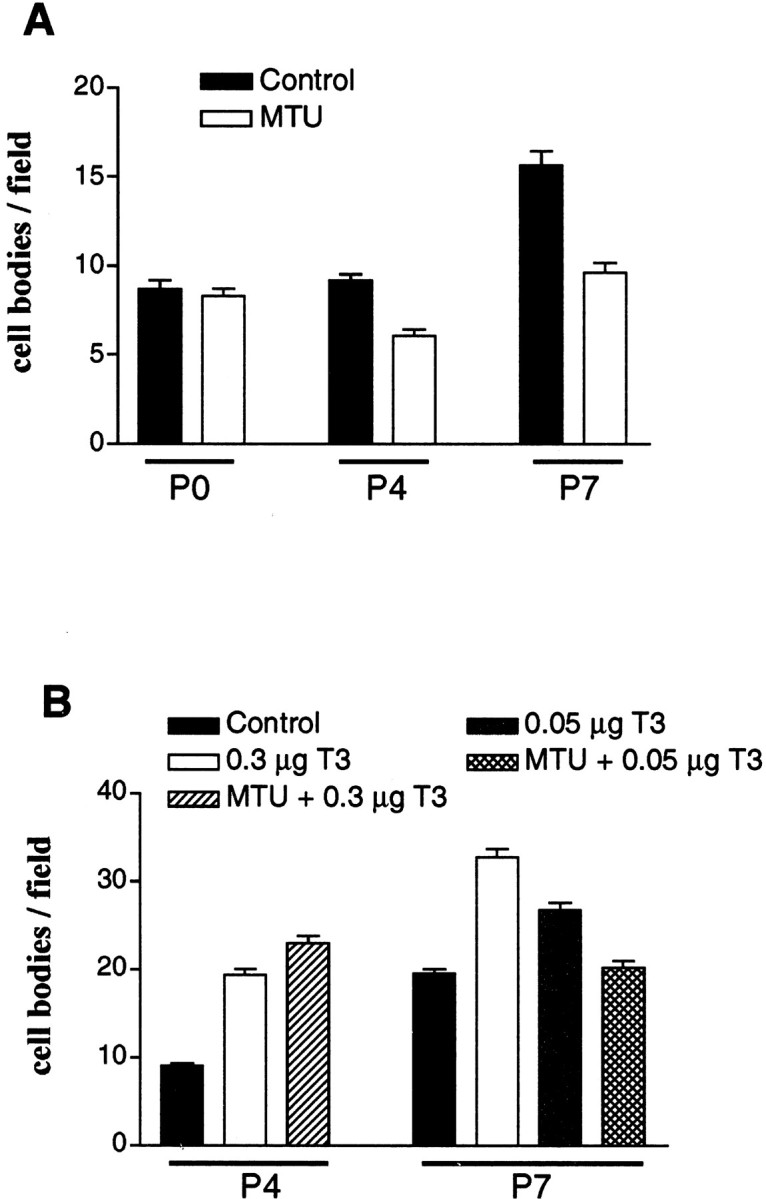
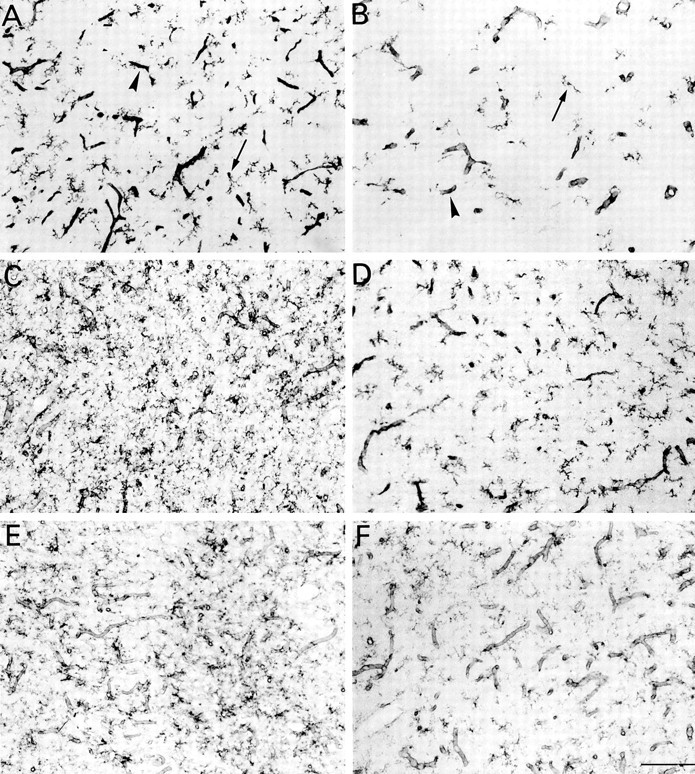
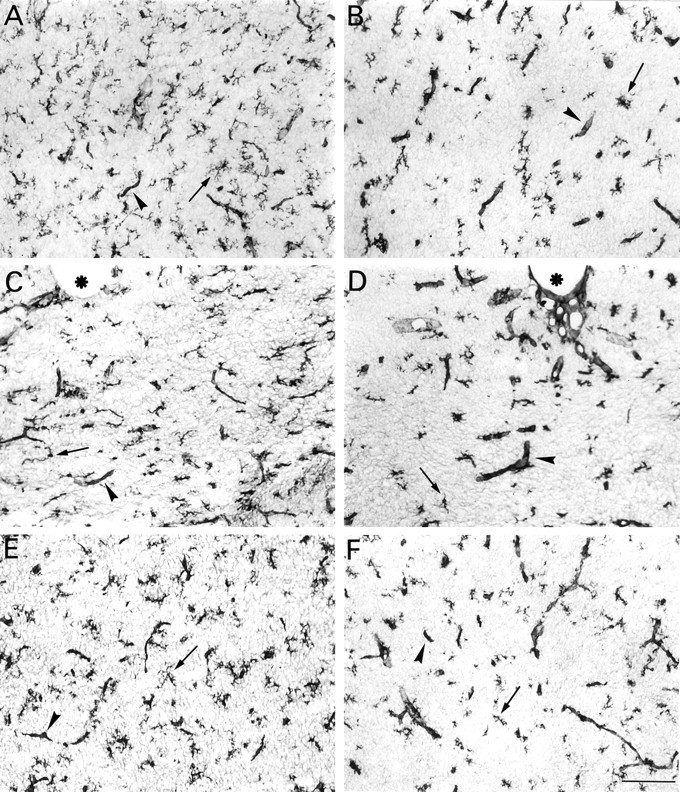
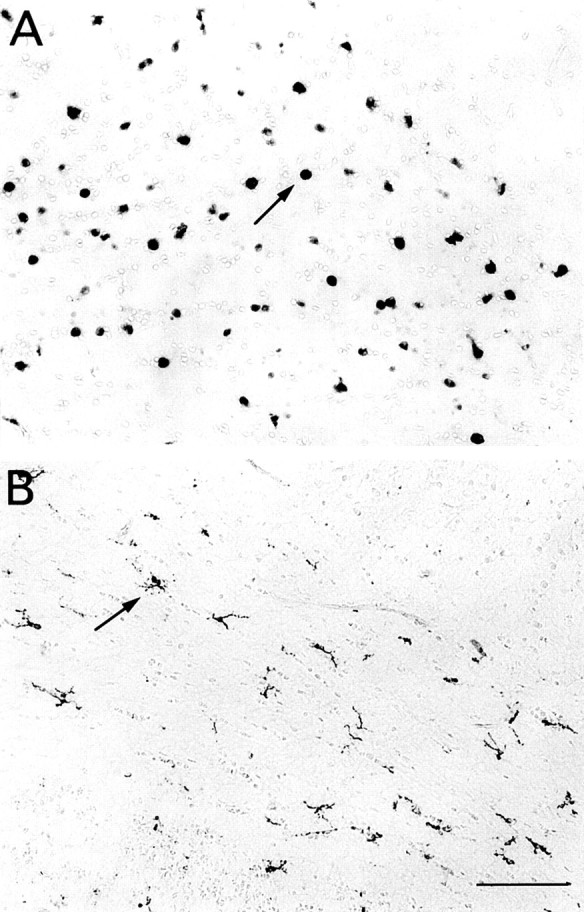
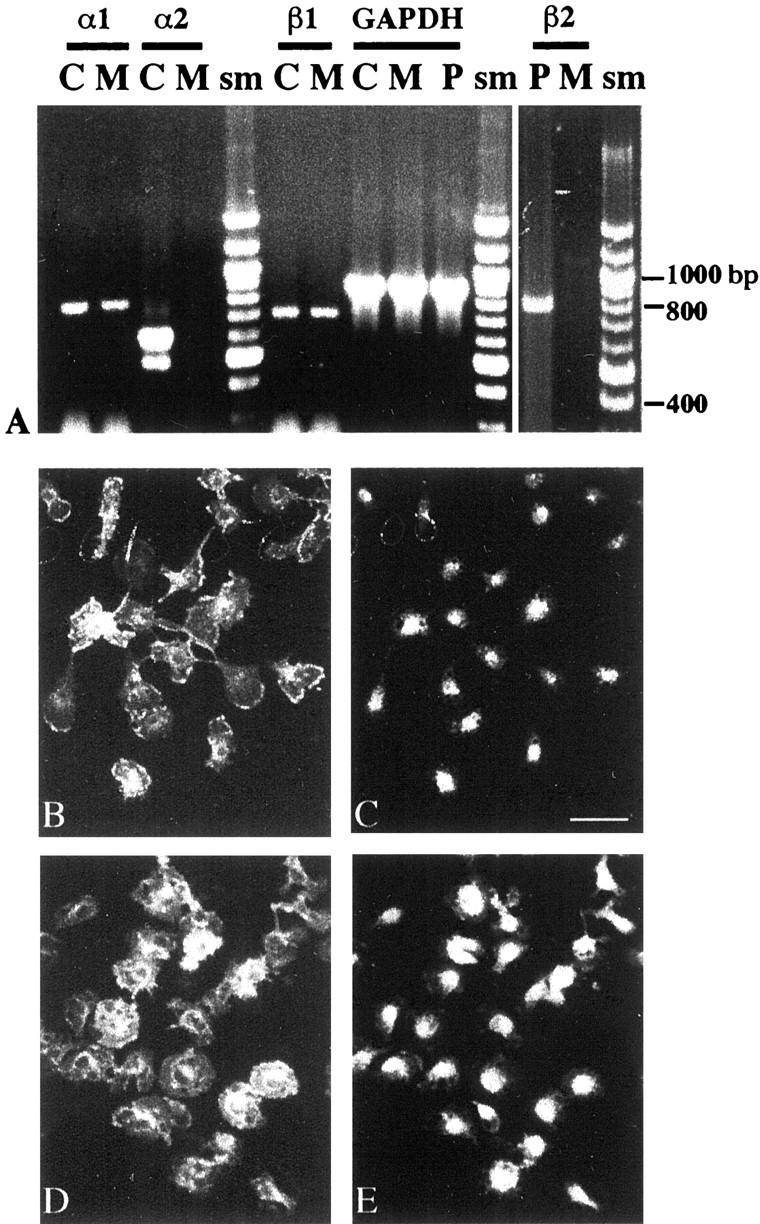
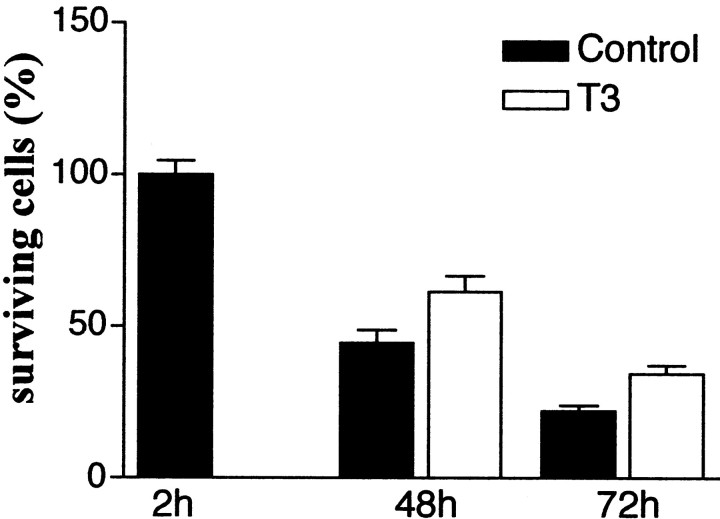
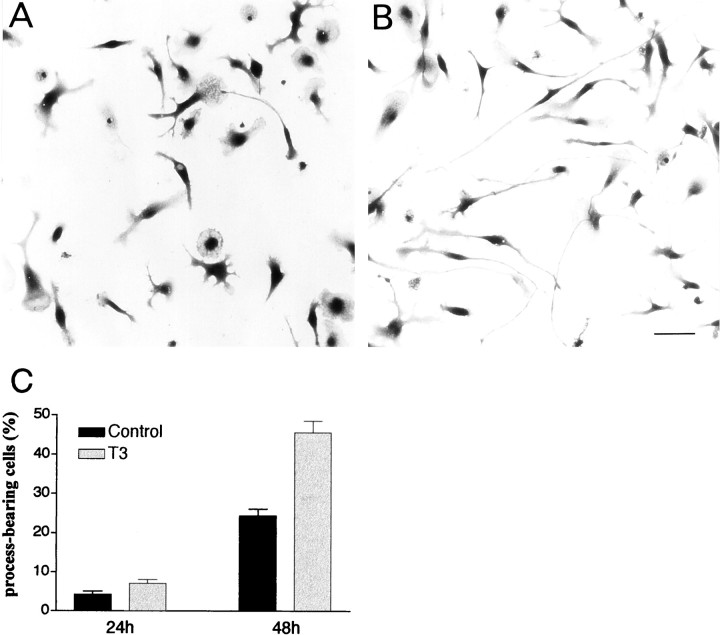
The postnatal development of rat microglia is marked by an important increase in the number of microglial cells and the growth of their ramified processes. We studied the role of thyroid hormone in microglial development. The distribution and morphology of microglial cells stained with isolectin B4 or monoclonal antibody ED1 were analyzed in cortical and subcortical forebrain regions of developing rats rendered hypothyroid by prenatal and postnatal treatment with methyl-thiouracil. Microglial processes were markedly less abundant in hypothyroid pups than in age-matched normal animals, from postnatal day 4 up to the end of the third postnatal week of life. A delay in process extension and a decrease in the density of microglial cell bodies, as shown by cell counts in the developing cingulate cortex of normal and hypothyroid animals, were responsible for these differences. Conversely, neonatal rat hyperthyroidism, induced by daily injections of 3,5,3'-triiodothyronine (T3), accelerated the extension of microglial processes and increased the density of cortical microglial cell bodies above physiological levels during the first postnatal week of life. Reverse transcription-PCR and immunological analyses indicated that cultured cortical ameboid microglial cells expressed the alpha1 and beta1 isoforms of nuclear thyroid hormone receptors. Consistent with the trophic and morphogenetic effects of thyroid hormone observed in situ, T3 favored the survival of cultured purified microglial cells and the growth of their processes. These results demonstrate that thyroid hormone promotes the growth and morphological differentiation of microglia during development.


Figures

Fig. 1.
Fig. 1.
Microglial cells in the parietal cortex of hypothyroid (A), euthyroid (B), and hyperthyroid rats treated with T3 (0.3 μg/gm body wt) (C) at P4. Representative fields in the cortical plate. Peroxidase staining with isolectin B4 reveals blood vessels (arrowheads) and branched microglial processes. A, B, Arrowspoint to microglial cells that are shown at higher magnification in theinsets. Microglial cell bodies and processes appear more numerous from A to C. Scale bar, 100 μm.
Fig. 2.
Fig. 2.
Microglial cell numbers in the cingulate cortex of hypothyroid, euthyroid, and hyperthyroid rats at P0, P4, and P7. Results are presented as the means ± SEM of microglial cells stained with isolectin B4. A, Untreated euthyroid rats (Control) and MTU-treated hypothyroid rats (MTU). Differences were significant between MTU-treated rats and controls at P4 and P7 (p < 0.001) and between MTU treatment at P4 and controls or MTU treatment at P0 (p < 0.01). B, Saline-injected euthyroid rats (Control), hyperthyroid rats injected with T3 at 0.3 μg or 0.05 μg/gm body wt (0.3 μg T3 or 0.05 μg T3), and MTU-treated rats that were injected with T3 at 0.3 μg or 0.05 μg/gm body wt (MTU + 0.3 μg T3 or MTU + 0.05 μg T3). At P4, differences between controls and T3-treated animals with or without MTU were significant (p < 0.001); differences between animals treated with T3 alone and animals treated with both MTU and T3 (T3 at 0.3 μg/gm body wt) were not significant (p > 0.05). At P7, there were significant differences between controls and T3-treated animals without MTU (p < 0.001) and between 0.3 μg T3 and 0.05 μg T3 treatments (p < 0.01). Differences between controls and animals treated with both MTU and T3 (T3 at 0.05 μg/gm body wt) were not significant (p > 0.05). Statistical analyses were performed using the Kruskall–Wallis nonparametric ANOVA test followed by Dunn's multiple comparisons test.
Fig. 3.
Fig. 3.
Developmental changes in microglia in the parietal cortex of euthyroid (A, C,E) and hypothyroid (B, D,F) rats at P7 (A,B), P14 (C, D), and P22 (E, F). Peroxidase staining with isolectin B4 in gray matter. Arrowheads and small arrows point to blood vessels and microglial cell bodies, respectively. Note the marked increase in microglial processes between P7 and P14, the reduced intensity of microglial staining at P22 compared with P7 or P14, and the reduced density of microglial processes in hypothyroid rats. Scale bar, 100 μm.
Fig. 4.
Fig. 4.
Microglial cells in the forebrain of euthryoid (A, C, E) and hypothyroid rats (B, D, F) at P10. A, B, Cingulate cortex.C, D, Medial part of the corpus callosum;asterisks label the bottom of the interhemispheric scissura. E, F, Septal nuclei; peroxidase staining with isolectin B4. Arrowheads and small arrows point to blood vessels and microglial cell bodies, respectively. Overall, microglial cell processes are shorter in hypothyroid rats. Scale bar, 100 μm.
Fig. 5.
Fig. 5.
Macrophages in the corpus callosum of euthyroid (A) and hyperthyroid rats treated with T3 (0.3 μg/gm body wt) (B) at P7. Fields localized above and lateral to the external edge of the lateral ventricle. Immunoperoxidase staining was with ED1 mAb. Arrowsindicate two stained cells without (A) or with (B) processes. Note the presence of stained cells with long, branched processes in hyperthyroid animals (B). Scale bar, 100 μm.
Fig. 6.
Fig. 6.
Expression of TR genes in cultured microglial cells. A, RT-PCR analysis. Ethidium bromide-stained agarose gel of RT-PCR products generated from TRα1, TRα2, TRβ1, TRβ2, and GAPDH mRNAs (α1, α2, β1, β2, and GAPDH). Total RNA was extracted from cultures of ameboid microglial cells (M) kept 1 d in vitroafter purification from primary glial cultures. RNA from adult rat cerebral cortex (C) was used as positive control for TRα1, TRα2, and TRβ1 amplifications. TRα2-amplified products generated with the same primers appear as two bands in the same lane (α2/C) and correspond to TRα2vI (top band) and TRα2vII. A TRβ2-amplified product was obtained from adult pituitary (P) RNA. TRα1 and TRβ1 were the only TR isoforms detected in microglial mRNA. Comparable levels of GAPDH-amplified products were obtained from the different RNA preparations. sm, Molecular size marker. Immunocytochemical detection of TRα and TRβ in microglial cultures (B, C, D,E) is shown. Purified microglial cells were kept for 1 d in vitro before fixation. Double staining of fixed cells with isolectin B4 (FITC, B) and rabbit polyclonal antibodies raised against rat TRα (TRITC,C) is shown. Staining with isolectin B4 (FITC,D) and rabbit polyclonal antibodies raised against rat TRβ (TRITC, E) is shown. Scale bar, 30 μm.
Fig. 7.
Fig. 7.
Influence of T3 on the survival of cultured microglial cells. Purified microglial were plated (5000 cells per well) in DMEM containing 1% T3/T4-depleted FCS. The cells were cultured in this medium without (Control) or with T3 (500 nm), which was added 3 hr after plating. The number of surviving cells was determined at the indicated time and is expressed as percentage of the mean control value determined 2 hr after plating. Data are means ± SEM of four independent experiments with three to four determinations in sister wells per experiment. The actual number of surviving cells counted in each well 2 hr after plating (control value) (see Materials and Methods) always exceeded 100. Differences between control and T3-treated cultures were significant at 48 and 72 hr (p < 0.01) according to comparisons by one-way ANOVA followed by Student–Newman–Keuls multiple comparisons test.
Fig. 8.
Fig. 8.
Influence of T3 on the extension of microglial processes. Morphology of purified microglial cells cultured for 2 d in a serum-free medium without (A) or with (B) T3. Toluidine blue staining was performed. T3 stimulates the development of long processes. Scale bar, 50 μm. C, Quantitative analysis. Purified microglial cells were cultured for 24 or 48 hr in DMEM without (Control) or with T3 before determination of the proportion of process-bearing cells defined as cells displaying at least one process three time longer than the cell body diameter. Data are means ± SEM of three and four independent experiments for 24 and 48 hr cultures, respectively, with three to four determinations in sister wells per experiment. Differences between control and T3-treated cultures were significant at 48 hr according to comparisons with Student's t test (p < 0.001).

References

    1. Alliot F, Godin I, Pessac B. Microglia derive from progenitors originating from the yolk sac and which proliferate in the brain. Dev Brain Res. 1999;117:145–152. - PubMed
    1. Alvarez-Dolado M, Ruiz M, Del Rio J, Alcantara S, Burgaya F, Sheldon M, Nakajima K, Bernal J, Howell BW, Curran T, Soriano E, Muñoz A. Thyroid hormone regulates reelin and dab1 expression during brain development. J Neurosci. 1999;19:6979–6993. - PMC - PubMed
    1. Antel JP, Owens T. Immune regulation and CNS autoimmune disease. J Neuroimmunol. 1999;100:181–189. - PubMed
    1. Arpin C, Pihlgren M, Fraichard A, Aubert D, Samarut J, Chassande O, Marvel J. Effects of T3R alpha 1 and T3R alpha 2 gene deletion on T and B lymphocyte development. J Immunol. 2000;164:152–160. - PubMed
    1. Ashwell K. The distribution of microglia and cell death in the fetal rat forebrain. Dev Brain Res. 1991;58:1–12. - PubMed

Publication types

MeSH terms

LinkOut - more resources