. 2001 Mar 15;21(6):2104-12.
doi: 10.1523/JNEUROSCI.21-06-02104.2001.

Membrane potential and conductance changes underlying length tuning of cells in cat primary visual cortex

Affiliations

Membrane potential and conductance changes underlying length tuning of cells in cat primary visual cortex

J S Anderson et al. J Neurosci. .

Abstract

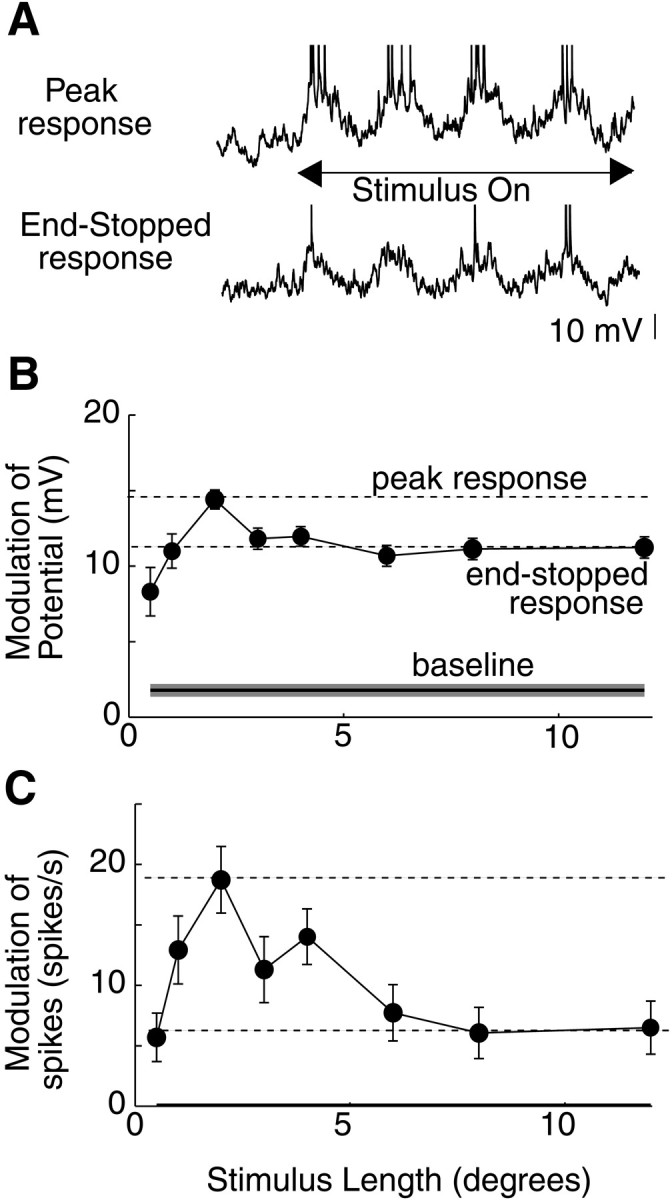
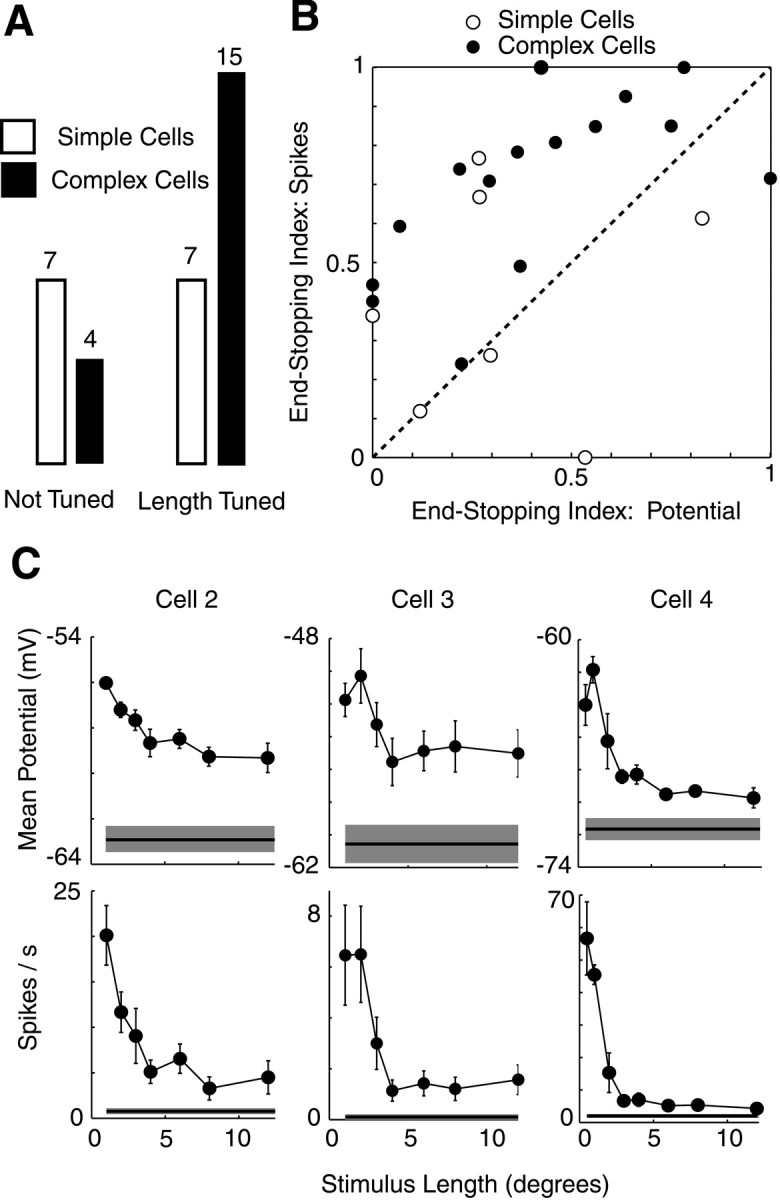
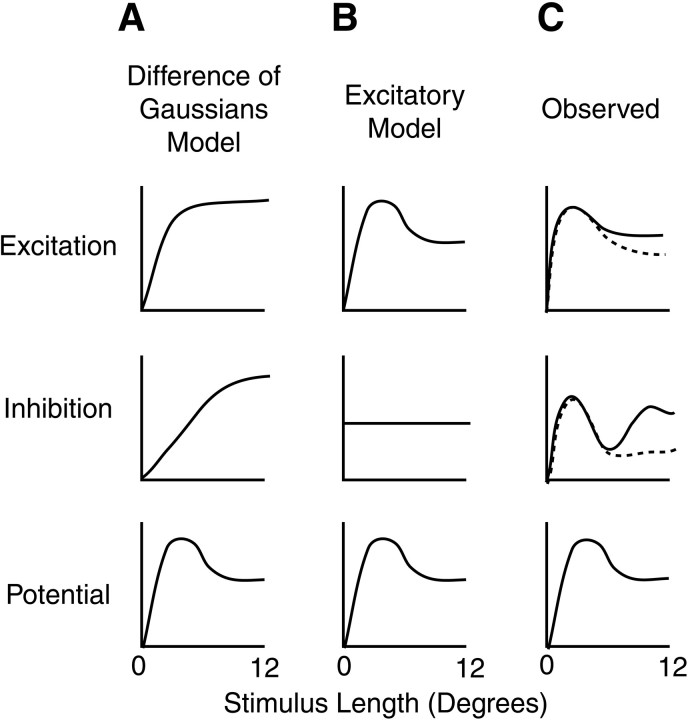
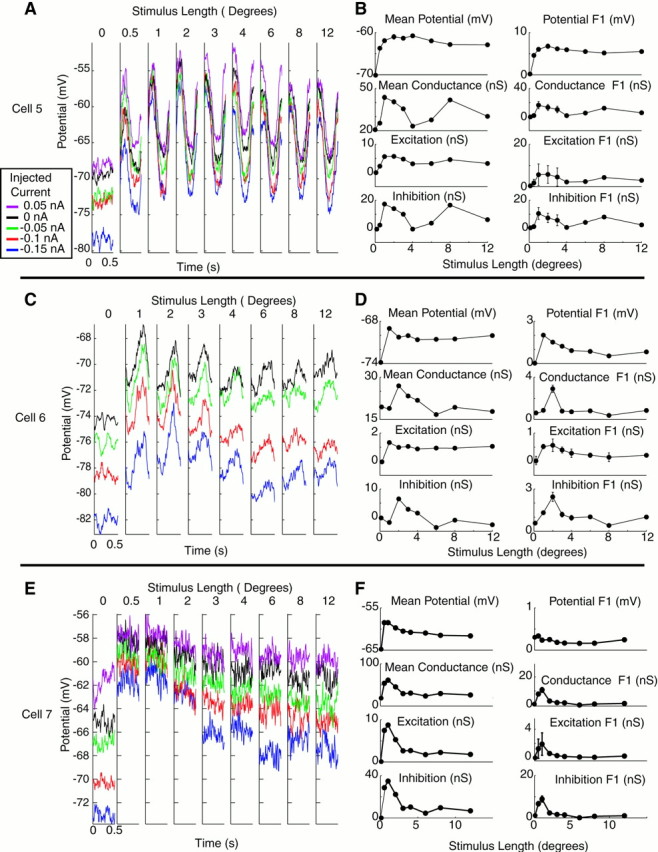
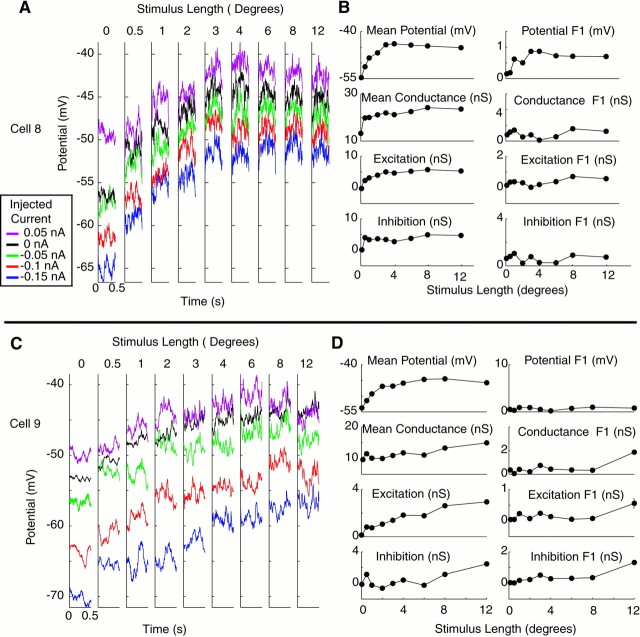
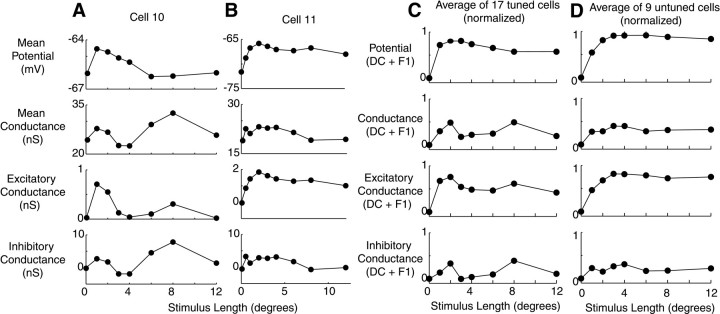
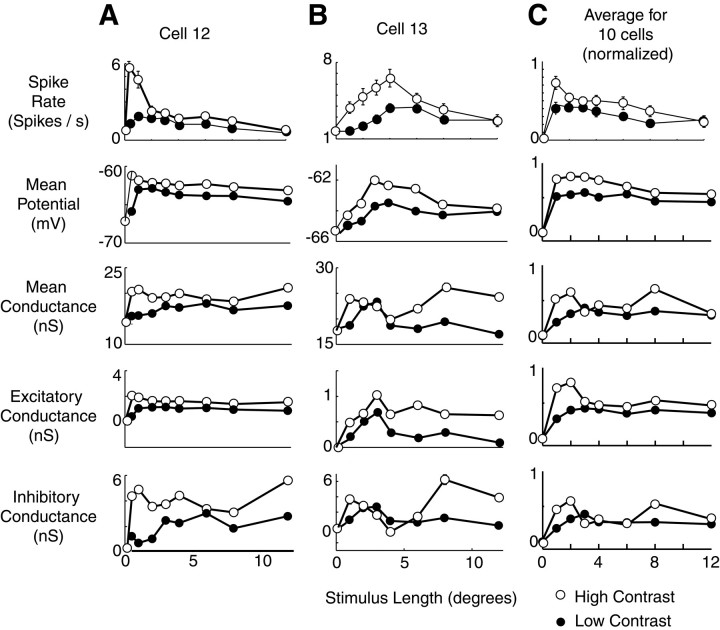
Spike responses for many cells of cat primary visual cortex are optimized for the length of a drifting grating stimulus. Stimuli that are longer or shorter than this optimal length elicit submaximal spike responses. To investigate the mechanisms responsible for this length tuning, we have recorded intracellularly from visual cortical neurons in the cat while presenting drifting grating stimuli of varying lengths. We have found that the membrane potential responses of the cells also exhibit length tuning, but that the suppression of spike responses at lengths longer than the preferred is 30-50% stronger than the corresponding suppression of the membrane potential responses. This difference may be attributed to the effects of spike threshold. Furthermore, using steady injected currents, we have measured changes in the excitatory and inhibitory components of input conductance evoked by stimuli of different lengths. We find that, compared with optimal stimuli, long stimuli evoke both an increase in inhibitory conductance and a decrease in excitatory conductance. These two mechanisms differ in their contrast sensitivity, resulting in stronger end stopping and shorter optimal lengths for high-contrast stimuli. These patterns suggest that response suppression for long stimuli is generated by a combination of active inhibition from stimuli outside the excitatory receptive field, as well as decreased excitation from other cortical cells that are themselves end-inhibited.


Figures

Fig. 1.
Fig. 1.
Length tuning of membrane potential and spikes in a simple cell. A, Membrane potential responses to a 2 sec drifting grating stimulus of 2° length (top) and 12 ° length (bottom). Traces show 0.5 sec before stimulus is presented. B, Peak-to-peak modulation of the membrane potential response as a function of length.Solid horizontal line shows modulation in the absence of a visual stimulus. Dashed horizontal lines show maximal (peak response) and end-stopped responses. End-stopped responses are calculated by finding the minimal response for stimuli longer than the length of the peak response. The end-stopped response is then taken as the mean of all responses of stimuli longer than or equal to the stimulus length of this minimal response. Error bars for data points and the shaded area around baseline show ±SEM across stimulus trials. C, Modulation of spikes as a function of length.
Fig. 2.
Fig. 2.
Length tuning for membrane potential and spikes in 33 cells. A, Proportion of simple and complex cells exhibiting length tuning (ESI > 0.1 for potential or spikes).B, Comparison of length tuning as measured by membrane potential and spike responses. Mean membrane potential responses are shown for complex cells and modulation of membrane potential for simple cells. C, Length-tuning curves for membrane potential and spikes for three complex cells. Error bars and shaded regions around baseline show ±SEM.
Fig. 3.
Fig. 3.
Proposed conductance models for length tuning of membrane potential. Rows show excitatory conductance, inhibitory conductance, and membrane potential responses as a function of length. A, Difference-of-Gaussians model.B, Excitatory model. C, Schematic of results obtained in the present study.
Fig. 4.
Fig. 4.
Measurement of conductance as a function of length for three end-inhibited cells. A, C,E, Average membrane potential responses with injected currents as a function of length for three cells. Eachtrace is color-coded for injected current level (seeinset legend) and represents one cycle of the drifting grating stimulus. Length of 0 indicates a blank stimulus.B, D, F, Length-tuning curves for mean and modulation of membrane potential, input conductance, and excitatory and inhibitory components of changes in input conductance. For potential, error bars show ±SEM across stimulus trials. For conductance measurements, error bars show ±SEM across conductance measurements taken from different subsets of the data (see Materials and Methods). Modulation represents peak-to-peak modulation of each parameter (2 * F1).
Fig. 5.
Fig. 5.
Measurement of conductance as a function of length for two cells without end inhibition. Format is identical to Figure4.
Fig. 6.
Fig. 6.
Length tuning of membrane potential and input conductance in 26 cells. A, B, Mean potential, conductance, and excitatory and inhibitory components of conductance for two complex cells. Format is identical to Figure4B. Error bars for both cells are almost entirely covered by data points. C, Average potential and conductance responses in a population of 17 cells showing length tuning. In each cell, the mean and modulation responses are added for each of the four graphs and normalized to have peak 1 and baseline 0. Normalized traces for each of the four graphs were then averaged for all 17 cells. Error bars corresponding to SEM for cells are covered by data points.D, Average potential and conductance responses in a population of nine cells not showing length tuning. Error bars corresponding to SEM for cells are covered by data points.
Fig. 7.
Fig. 7.
Effect of stimulus contrast on length tuning of membrane potential and conductance. A, B, Mean potential, conductance, and excitatory and inhibitory components of conductance for two complex cells at high (open circles) and low (filled circles) contrast. Format is identical to Figure 4B, except that two contrast levels are shown. For both cells, high contrast was 64%, and low contrast was 16%. C, Average potential and conductance responses at high and low contrast in a population of 10 cells. Mean spike rate, membrane potential, input conductance, and excitatory and inhibitory components of conductance are shown. Traces were first normalized for each cell as in Figure 5 and then averaged across cells. High contrast among the cells ranged from 30 to 64%, and low contrast ranged from 8 to 16%.

References

    1. Albus K, Fries W. Inhibitory sidebands of complex receptive fields in the cats striate cortex. Vision Res. 1980;20:369–372. - PubMed
    1. Anderson J, Carandini M, Ferster D. Orientation tuning of membrane conductance in cat visual cortex. J Neurophysiol. 2000;84:909–926. - PubMed
    1. Bauman LA, Bonds AB. Inhibitory refinement of spatial frequency selectivity in single cells of the cat striate cortex. Vision Res. 1991;31:933–944. - PubMed
    1. Blakemore C, Tobin EA. Lateral inhibition between orientation detectors in the cat's visual cortex. Exp Brain Res. 1972;15:439–440. - PubMed
    1. Blanton MG, Lo Turco JJ, Kriegstein AR. Whole cell recording from neurons in slices of reptilian and mammalian cerebral cortex. J Neurosci Methods. 1989;30:203–210. - PubMed

Publication types

LinkOut - more resources