. 2001 Mar 15;21(6):2113-22.
doi: 10.1523/JNEUROSCI.21-06-02113.2001.

Symmetry, stereotypy, and topography of odorant representations in mouse olfactory bulbs

Affiliations

Symmetry, stereotypy, and topography of odorant representations in mouse olfactory bulbs

L Belluscio et al. J Neurosci. .

Abstract

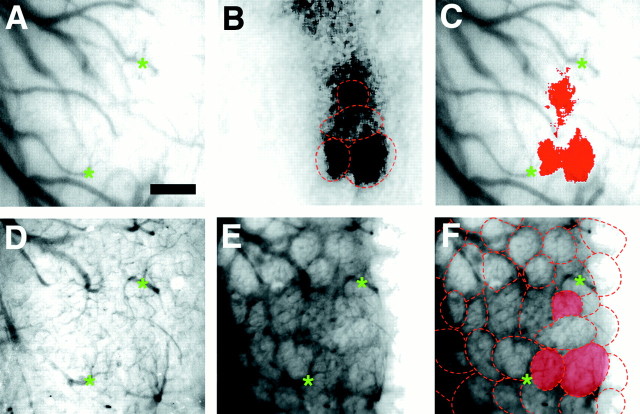
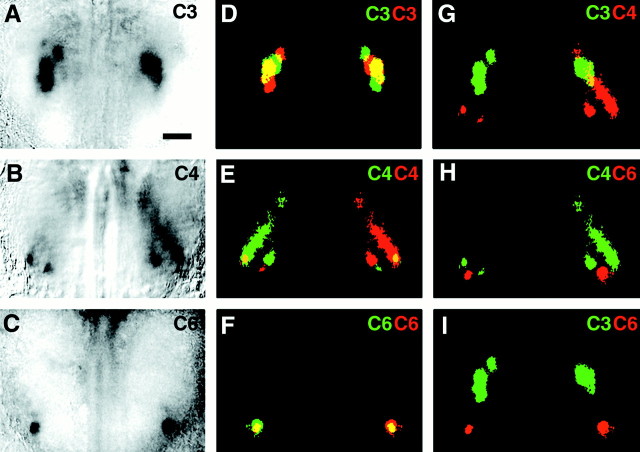
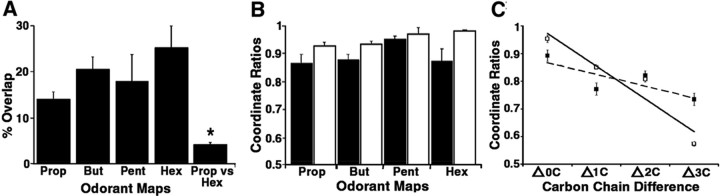
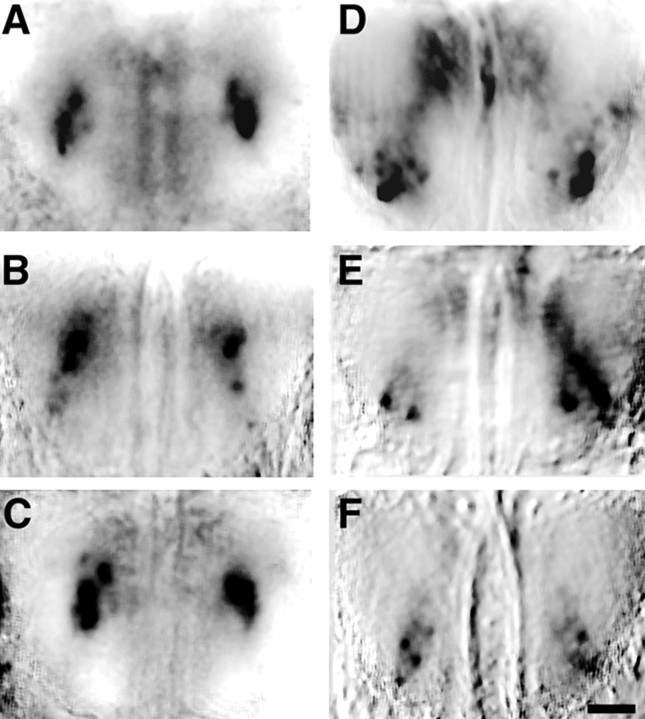
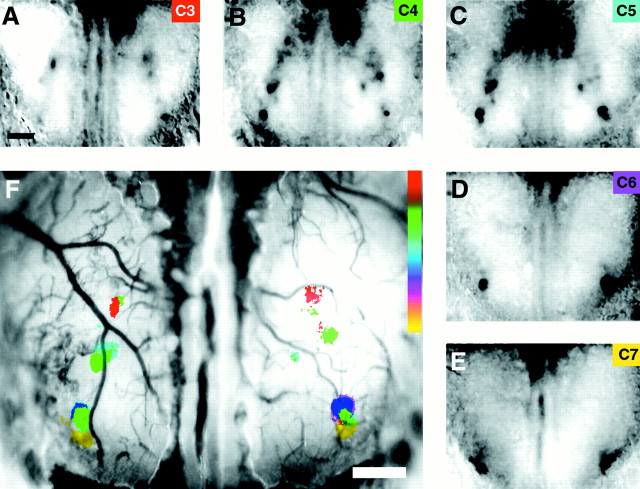
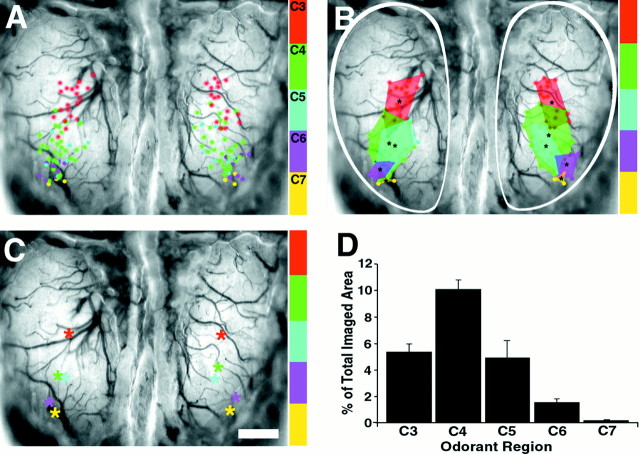
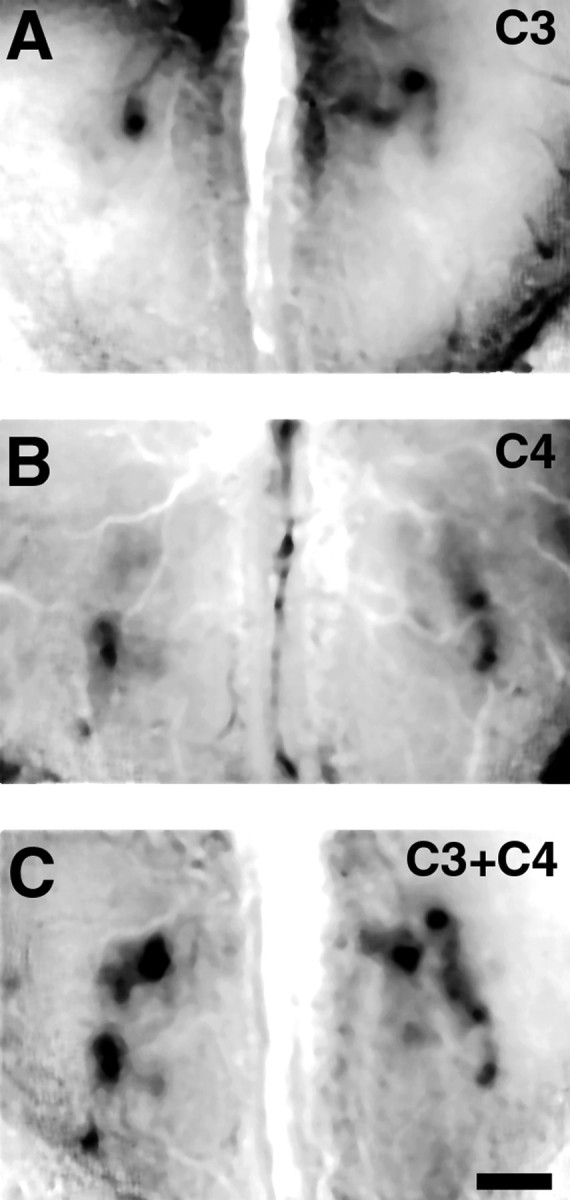
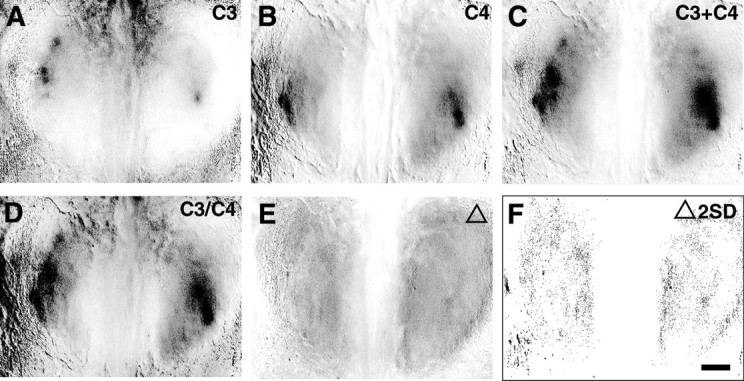
The molecular basis of vertebrate odorant representations has been derived extensively from mice. The functional correlates of these molecular features were visualized using optical imaging of intrinsic signals in mouse olfactory bulbs. Single odorants activated clusters of glomeruli in consistent, restricted portions of the bulb. Patterns of activated glomeruli were clearly bilaterally symmetric and consistent in different individual mice, but the precise number, position, and intensity of activated glomeruli in the two bulbs of the same individual and between individuals varied considerably. Representations of aliphatic aldehydes of different carbon chain length shifted systematically along a rostral-caudal strip of the dorsal bulb, indicating a functional topography of odorant representations. Binary mixtures of individual aldehydes elicited patterns of glomerular activation that were topographic combinations of the maps for each individual odor. Thus the principles derived from the molecular organization of a small subset of murine olfactory receptor neuron projection patterns-bilateral symmetry, local clustering, and local variability-are reliable guides to the initial functional representation of odorant molecules.


Figures

Fig. 1.
Fig. 1.
Discrete activated regions visualized with intrinsic signal imaging correspond to anatomical glomeruli.A, Blood vessel pattern overlying the imaged region visualized through thinned bone. Green asterisksindicate vessel landmarks. B, Olfactory map evoked by 1% propanal produced several active regions. Superimposed on the optical image are outlines of the glomerular pattern derived from F. The strongly activated regions are almost entirely confined to the anatomical borders of the glomeruli.C, Activity map from B thresholded at 2 SDs, pseudocolored, and superimposed on the blood vessel pattern from A. Three distinct active regions the size and shape of anatomical glomeruli are strongly activated.D, Blood vessel pattern of imaged area used for subsequent alignment after removal of bone and dura; many of the same blood vessels are readily visible. E, Glomeruli revealed by vital dye staining with the voltage-sensitive dye RH414 and observed with epifluorescence microscopy. F,Outlines of individual glomeruli from E; the three activated glomeruli seen in B andC are highlighted. Scale bar, 200 μm.
Fig. 2.
Fig. 2.
Bilateral symmetry of functional representations.A–C, Dorsal views of both olfactory bulbs in an adult mouse, imaged through thinned bone. Bilateral olfactory maps were evoked by 1% propanal (A), 1% butanal (B), and 1% hexanal (C). Responses to all three odorants activate roughly corresponding regions in the two hemispheres; in the case of hexanal (C), an apparently corresponding glomerulus was activated in each hemisphere. In all panels, caudal is at thetop of the panel. D–F, Duplicate maps of images (A–C), respectively, in which one copy has been flipped horizontally, pseudocolored (original is red and inverted copy is green), and superimposed on the original. Overlapping regions of activity are yellow. Activity patterns show only partial overlap, indicating that in general they are not precise mirror images. G, Color-coded activity maps comparing active regions for propanal (green) superimposed on butanal map (red) reveal that odorants which differ by only one carbon show some overlapping regions (yellow).H, I, Superimposed activity maps for odors differing by two carbons (H, butanal, green; hexanal,red) or three carbons (I, propanal,green; hexanal, red) show no overlap. Scale bar (shown in A for A–I): 500 μm.
Fig. 3.
Fig. 3.
Measurements of interbulbar symmetry.A, Degree of symmetry for individual odorant representations were determined from bilateral image overlap (Fig. 2); percentage overlap was calculated and averaged for each odorant. The overlap value ranged from 14 to 25% for propanal to hexanal, respectively. These values, although lower than expected for perfect symmetry, are nonetheless significantly greater than overlap between different odors, such as propanal and hexanal (Student'st test, p < 0.001).B, Average symmetry of the centroid of activation by different odorants, derived from the x(black) and y (white) values of the left and right bulb centroids (see Materials and Methods). The average centers of activity are much more symmetric than the precise overlap of glomeruli as determined in A.C, Symmetry of related odorants determined by comparing the averaged x and y centroid ratios of odorant maps elicited by the same odorant (0C) as inB, and odorants differing by one to three carbons (1C, 2C, 3C). Linear regression of x (▪,R2 = 0.6443) andy (■, R2 = 0.9045) values demonstrates that increasing carbon chain length results in significantly greater change in the anterior–posterior axis (y) than in the medial–lateral axis (x).
Fig. 4.
Fig. 4.
Stereotypy of odorant maps. A–C, Bilateral dorsal view of optical maps of both bulbs from three different mice in response to 1% propanal reveal similar patterns. All maps contain a region of dense activation of several glomeruli near the center of each bulb. D–F, Odorant maps evoked by 1% butanal in three different mice demonstrate a similar resemblance to one another. Each map consisted of two to three highly active glomeruli in a more rostral–lateral region of the dorsal bulb. Caudal is toward the top of each panel. Scale bar, 500 μm.
Fig. 5.
Fig. 5.
Topographic representation of odorants.A–E, Bilateral odorant maps of the response to a series of aliphatic aldehydes (1%, 3–7 carbons, as noted at the top right-hand corner of each panel). All maps were derived from the same mouse. Regions of highest activity move progressively rostral and lateral with increasing carbon chain length. The resemblance of each map to its nearest neighbor is apparent. F, Composite image in which each map has been color coded and superimposed on a single olfactory bulb image containing the blood vessel pattern for the imaged mouse. Structurally related odorants evoke overlapping patterns of activity along a caudal–medial to rostral–lateral strip of both bulbs. Intermediate colors in the spectrum represent overlap of adjacent color maps. Caudal is toward the topof each panel. Scale bars, 500 μm.
Fig. 6.
Fig. 6.
Population topography demonstrates clustering, symmetry, and overlap of odor responsive regions. A, Composite map depicting the active centers from 43 different odorant maps in response to the aliphatic aldehyde odorants containing three to seven carbons (1% concentration), color coded for odorant, and superimposed on a single olfactory bulb, blood vessel image. In the aggregate image, active centers for each odorant are clustered in distinct but partially overlapping regions. B, Perimeters encompassing each odorant cluster depicted inA illustrate the consensus regions of activity for individual odorants and the overlap with consensus regions of neighboring odorants. Note the rostral–lateral progression of active regions as odorants increase in carbon chain length.C, Centroids of the activated regions for each odorant-responsive region depicted in B plotted onto a composite map demonstrate symmetry of odorant maps at a population level. D, Area of each odorant-responsive region from both bulbs expressed as a percentage of the entire imaged bulb area (outlined by the white trace in B). Scale bar, 500 μm.
Fig. 7.
Fig. 7.
Representation of simple binary mixtures.A, Propanal (1%) activates two discrete glomeruli on the right bulb and one on the left. An additional activated region is visible in the rostral region of theright bulb. B, Optical map of odorant response to 1% butanal reveals two active peaks in each bulb located in a more rostral–lateral region, with some residual activity detected more caudally. C, Optical map of the olfactory bulb response to an equal mixture of 1% propanal and 1% butanal reveals an additive pattern of activity. Each of the features detected within the individual odorant maps (A andB) are represented within the mixture map. Regions of lower activity also appear to be additive, suggesting that they represent specific lower level activity and not nonspecific background. Maps were collected sequentially from the same mouse. Caudal is toward the top of the images. Scale bar, 500 μm.
Fig. 8.
Fig. 8.
Binary mixtures are the quantitative sum of individual odorant maps. A–C, Set of optical maps collected within a single interleaved experiment showing response patterns to 2% propanal (A), 2% butanal (B), and a mixture of 1% of each (C). D, Calculated odorant mixture map derived by summing the two individual odorant maps inA and B. E, Calculated difference map derived by subtracting the calculated mixture map (D) from the experimentally derived mixture map (C). F, The difference map, in which all pixels >2 SD difference from the mean areblack, reveals no significant quantitative difference between the experimental and mathematically derived maps, demonstrating that the activity map produced by this binary mixture is predicted by the sum of the two independent components. Scale bar, 500 μm.

References

    1. Baier H, Korsching S. Olfactory glomeruli in the zebrafish form an invariant pattern and are identifiable across animals. J Neurosci. 1994;14:219–230. - PMC - PubMed
    1. Bozza TC, Kauer JS. Odorant response properties of convergent olfactory receptor neurons. J Neurosci. 1998;18:4560–4569. - PMC - PubMed
    1. Brunjes PC. Unilateral naris closure and olfactory system development. Brain Res Brain Res Rev. 1994;19:146–160. - PubMed
    1. Cain WS, de Wijk R, Lulejian C, Schiet F, See LC. Odor identification: perceptual and semantic dimensions. Chem Senses. 1998;23:309–326. - PubMed
    1. Christensen TA, Pawlowski VM, Lei H, Hildebrand JG. Multi-unit recordings reveal context-dependent modulation of synchrony in odor-specific neural ensembles. Nat Neurosci. 2000;3:927–931. - PubMed

Publication types

LinkOut - more resources