. 2001 Apr;280(4):H1905-15.
doi: 10.1152/ajpheart.2001.280.4.H1905.

Localized injury in cardiomyocyte network: a new experimental model of ischemia-reperfusion arrhythmias

Affiliations

Localized injury in cardiomyocyte network: a new experimental model of ischemia-reperfusion arrhythmias

A Arutunyan et al. Am J Physiol Heart Circ Physiol. 2001 Apr.

Abstract

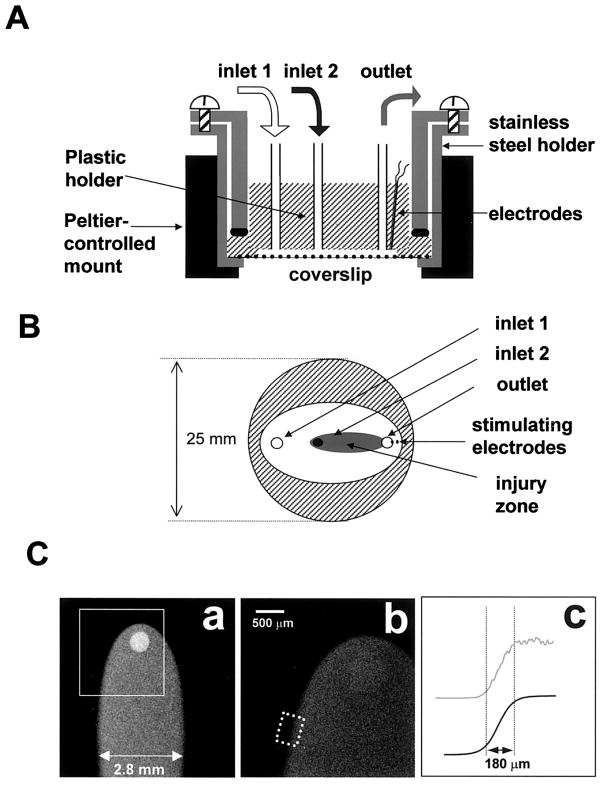
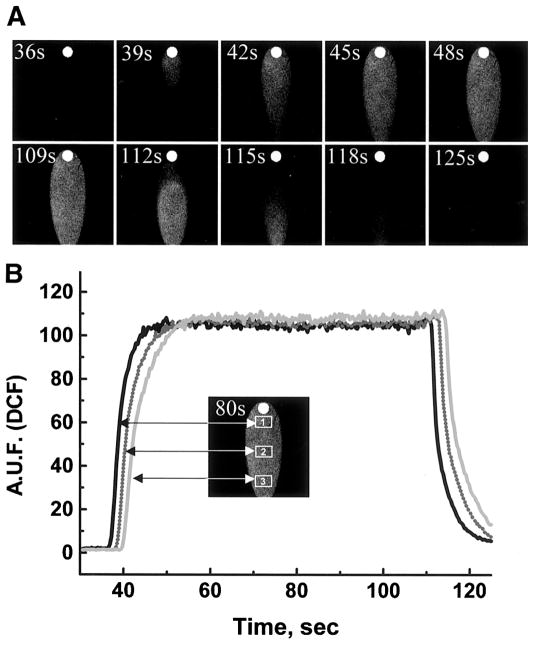
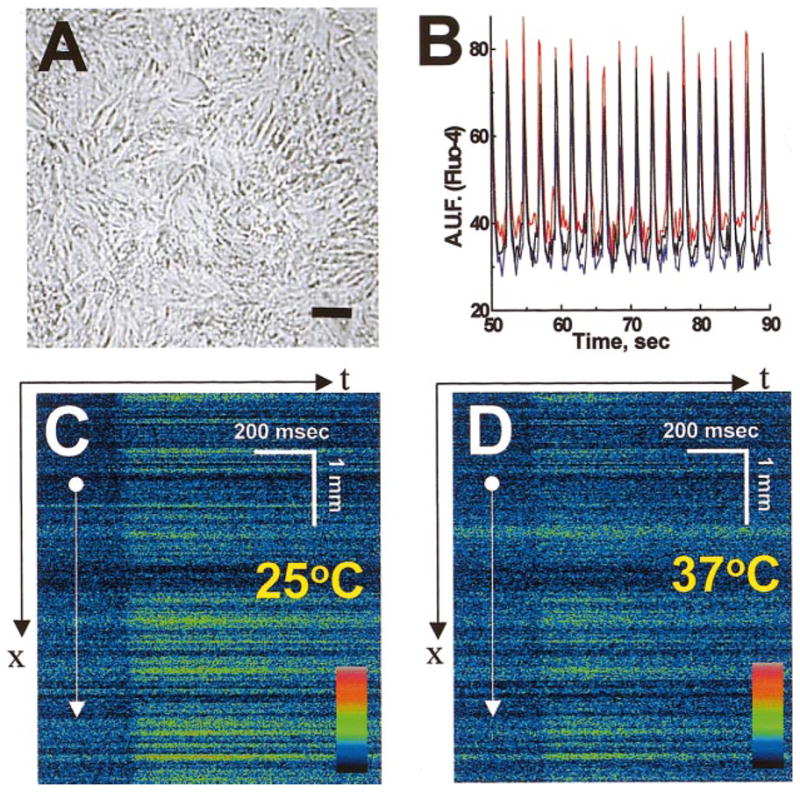
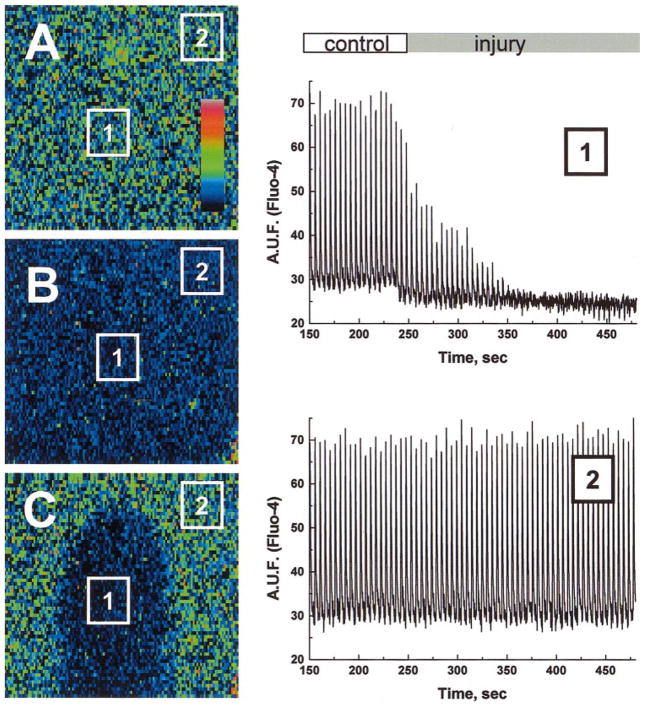
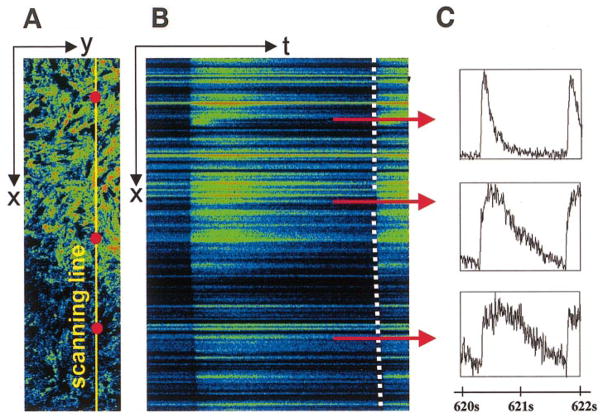
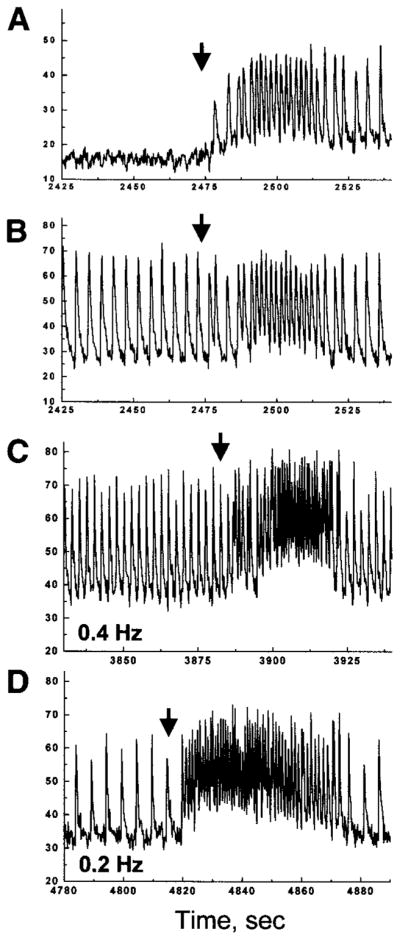
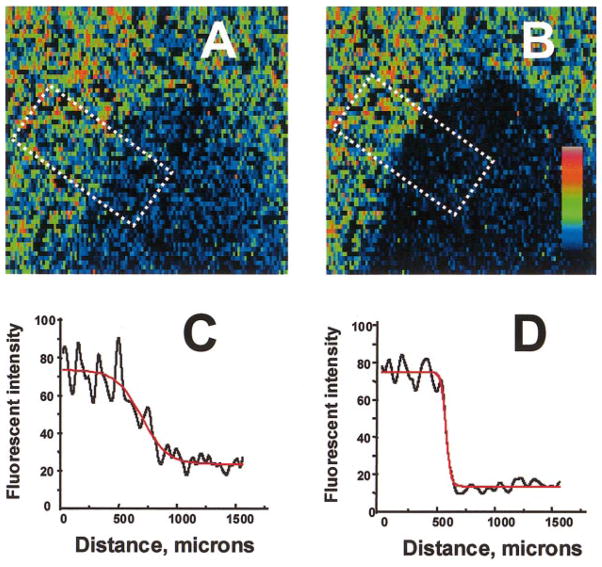
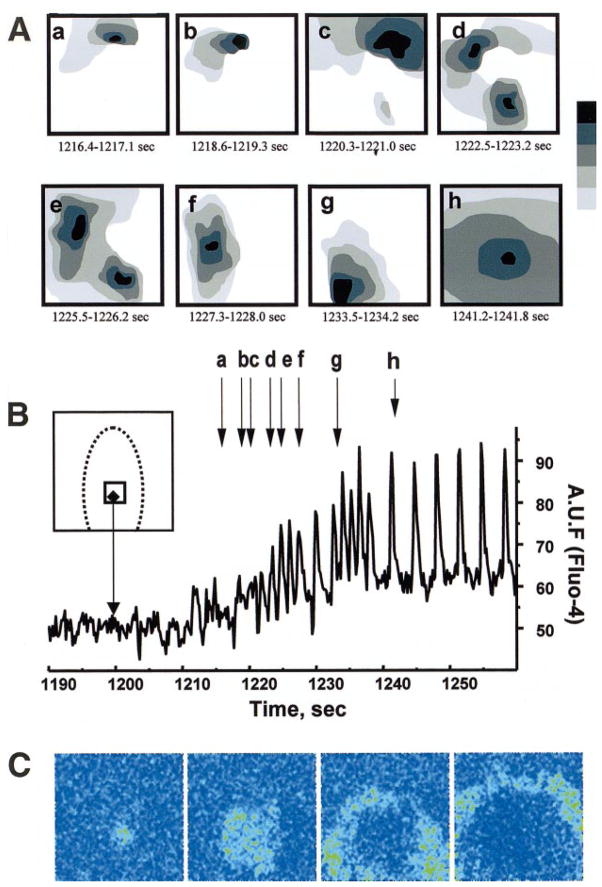
We developed a new experimental approach to study the effects of local injury in a multicellular preparation and tested the ability of the method to induce reperfusion arrhythmias in cardiomyocyte monolayers. A small region of injury was created using geometrically defined flows of control and ischemia-like solutions. Calcium transients were acquired simultaneously from injured, control, and border zone cells using fluo 4. Superfusion with the injury solution rapidly diminished the amplitude of calcium transients within the injury zone, followed by cessation of cell beating. Reperfusion caused an immediate tachyarrhythmic response in approximately 17% of experiments, with a wave front propagating from a single cell or small cell cluster within the former injury zone. Inclusion of a gap junction uncoupler (1 mM heptanol) in the injury solution narrowed the functional border and sharply increased the number of ectopic foci and the incidence of reperfusion arrhythmias. The model holds a potential to reveal both micro- and macroscopic features of propagation, conduction, and cell coupling in the normal and diseased myocardium and to serve as a new tool to test antiarrhythmic protocols in vitro.


Figures

Fig. 1
Fig. 1
Diagram of the superfusion chamber. A: cross section. Solutions are delivered to two inlets by an automated multisyringe pump. The chamber is placed inside a Peltier temperature-controlled mount, and cells are observed in an inverted mode using a Bio-Rad 1024 MRC confocal imaging system. B: bottom view. Only the plastic holder and coverslip are shown. Injury zone (I-zone) is depicted (shaded area). C: I-zone. The shape of an I-zone created on a cell-free coverslip by superfusion with dichlorofluorescein (DCF)-containing solution (a: ×2 objective; b: ×4 objective). In c, the top curve (gray line) illustrates the profile of mean fluorescence intensity across the border zone (dotted rectangle in b), the bottom curve (solid line) is its sigmoid fit (border zone width was defined as the distance between 10 and 90% of the curve maximum intensity).
Fig. 2
Fig. 2
Formation and washoff of the I-zone. A: images are composed from sequential 3-s frames acquired during formation (top) and washoff (bottom) of the I-zone created on a cell-free coverslip by superfusion with DCF-containing injury solution (×2 objective). B: 3 traces shown correspond to rectangular regions within the I-zone (inset) and illustrate the homogeneity and stability of the environment within the I-zone. AUF, arbitrary units of fluorescence.
Fig. 3
Fig. 3
Basic features of cultured cardiomyocyte networks. A: phase-contrast image of isotropic cardiomyocyte culture. Bar = 100 μm. B: cell beating as recorded using fluo 4-loaded cells. Traces represent intracellular Ca2+ transients recorded from three regions of interests (blue, red, and black). C and D: velocity of impulse propagation. In x-t mode, fluorescence intensity values are collected along a fixed x line every 2 ms and the lines are plotted sequentially, forming a x-t image. If the x line is positioned perpendicularly to the front of propagating calcium wave, the speed of the wave (dx/dt) can be derived from the slope of the line, which marks the upstroke of Ca2+ transients. The images show an action potential-induced calcium wave recorded at 25°C with a propagation speed of 9 cm/s (C) and at 37°C with propagation speed of 15 cm/s (D).
Fig. 4
Fig. 4
Appearance of ischemic I-zone within a monolayer of neonatal myocytes. The images illustrate the appearance of a monolayer before (A and B) and after 5 min of local injury (C). Because of the high degree of cell-to-cell coupling, the whole field alternates between a high intensity “systolic” state (A) and a low intensity “diastolic” state (B). The suppression of intracellular Ca2+ concentration ([Ca2+]i) transients in the I-zone is particularly evident during systole (C). Low spatial resolution of the images is due to the fast scanning required to capture the whole field during a single state. At this magnification, each of 128 × 128 pixels corresponds to a square of 44 μm on each side. In this and other figures, pseudocolor refers to relative [Ca2+]i. Two representative [Ca2+]i traces are shown: one from rectangular area inside the I-zone (1) and one from the rectangular area outside the I-zone (2).
Fig. 5
Fig. 5
Assessment of intracellular Ca2+ transients during ischemia. A: x-y image of border area of I-zone. Yellow line, position of the laser beam for the x-t scanning. B: x-t image (sample was scanned every 2 ms along the line placed across the I-zone). Each intracellular Ca2+ transient is reflected as a “flash” along the line. C: post acquisition analysis of x-t images allows one to extract high temporal resolution traces for each cell positioned along the line. Three red dots placed on the top of the x-y image (A) and three red lines positioned along corresponding areas of x-t image (B) designate approximate positions of cells for which intracellular Ca2+ transients are shown. The slope of the line, which marks the upstroke of intacellular Ca2+ transients (dotted line), shows a slowing of impulse conduction in the I-zone.
Fig. 6
Fig. 6
Reperfusion arrhythmias in spontaneously beating and paced cells monolayers. A and B: representative traces collected from the I-zone (A) and control area (B) during injury and subsequent reperfusion. The experiment was conducted in a spontaneously beating cell monolayer. C and D: representative traces acquired from the control area during injury and subsequent reperfusion of the monolayer paced at 0.4 (C) and 0.2 Hz (D). On restoration of the control Tyrode solution (arrows), rapid ectopic activity within the former I-zone overrode external stimulation, leading to a transient tachycardia encompassing the entire network.
Fig. 7
Fig. 7
Narrowing of functional borders of the I-zone in the presence of an uncoupler. A: appearance of the I-zone after 3 min of perfusion with injury solution. B: appearance of the I-zone after 3 min of perfusion with injury solution containing 1 mmol/l heptanol. C and D: maximum intensity of [Ca2+]i transients across the border was used to reveal the width of the functional border zone. The values of maximum fluo 4 intensity associated with high systolic intracellular Ca2+ levels were fitted into a sigmoidal curve, and border width was determined as the distance between 10 and 90% of the curve maximum intensity. The functional border zone was 120 ± 8 μm in the presence of 1 mM heptanol in injury solution (D) compared with 473 ± 51 μm without the uncoupler (C) (means ± SD, n = 4).
Fig. 8
Fig. 8
Origin and spatiotemporal pattern of reperfusion arrhythmias. A: gray scale-coded diagrams represent isochronal maps, which illustrate the formation of multiple ectopic clusters on removal of heptanol-containing injury solution. For clarity only, a few episodes are shown. Five scans were used to compose each diagram using [Ca2+]i transient wave fronts. The gray scale extends from 0 (black) to 700 ms (light gray). Note the formation of multiple ectopic loci on a border of the former I-zone (ag) followed by a dominant ectopic (h) emanating from the former I-zone. B: trace collected from rectangular box inside the I-zone (inset). Vertical arrows indicate the corresponding isochronal maps shown in A. C: four temporal derivatives (dF/dt) for five sequential frames, which illustrate propagation from the dominant ectopic shown. These images are similar to images produced by activation isochrones but do not require any assumption about what constitutes a local activation.

References

    1. Abramovich-Sivan S, Akselrod S. Simulation of atrial activity by a phase response curve based model of a two-dimensional pacemaker cells array: the transition from a normal activation pattern to atrial fibrillation. Biol Cybern. 1999;80:141–153. - PubMed
    1. Arutunian A, Webster D, Swift L, Sarvazyan N. A new experimental model to emulate ischemia-reperfusion arrhythmias in monolayers of cultured cardiomyocytes (Abstract) Biophys J. 2000;78:454A.
    1. Atsma DE, Bastiaanse EM, Ince C, van der Laarse A. A novel two-compartment culture dish allows microscopic evaluation of two different treatments in one cell culture simultaneously. Influence of external pH on Na+/Ca2+ exchanger activity in cultured rat cardiomyocytes. Pflügers Arch. 1994;428:296–299. - PubMed
    1. Barrigon S, Wang SY, Ji X, Langer GA. Characterization of the calcium overload in cultured neonatal rat cardiomyocytes under metabolic inhibition. J Mol Cell Cardiol. 1996;28:1329–1337. - PubMed
    1. Boersma L, Brugada J, Kirchhof C, Allessie M. Entrainment of reentrant ventricular tachycardia in anisotropic rings of rabbit myocardium. Mechanisms of termination, changes in morphology, and acceleration. Circulation. 1993;88:1852–1865. - PubMed

Publication types

MeSH terms