. 2001 Mar 13;98(6):3145-9.
doi: 10.1073/pnas.061014298. Epub 2001 Mar 6.

Dissipative metabolic patterns respond during neutrophil transmembrane signaling

Affiliations

Dissipative metabolic patterns respond during neutrophil transmembrane signaling

H R Petty et al. Proc Natl Acad Sci U S A. .

Retraction in

Abstract

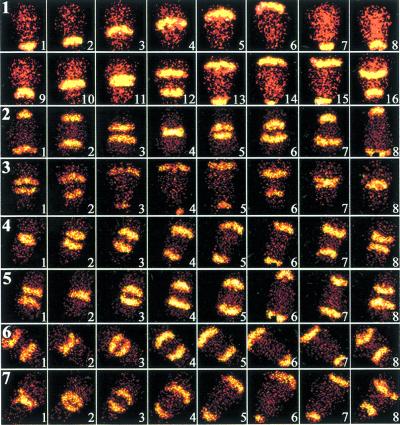
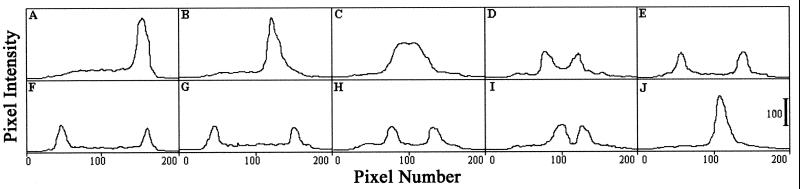
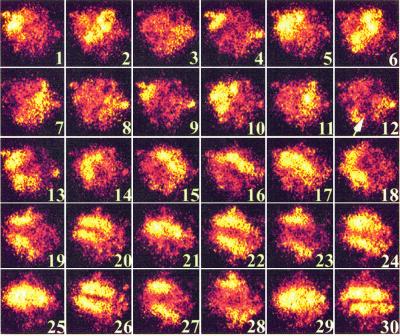
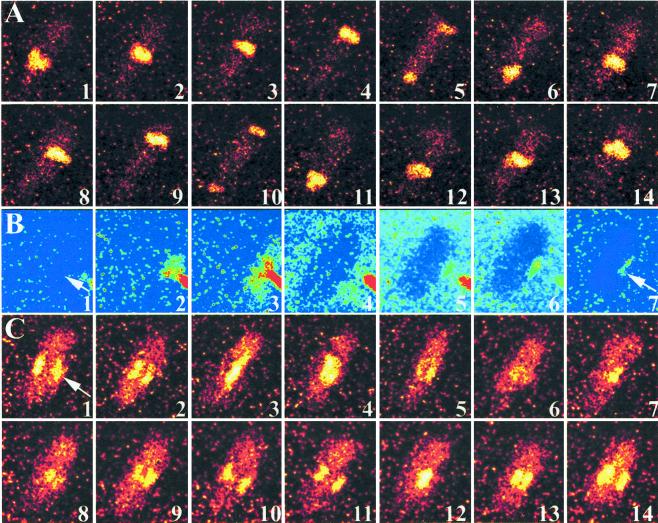
Self-organization is a common theme in biology. One mechanism of self-organization is the creation of chemical patterns by the diffusion of chemical reactants and their nonlinear interactions. We have recently observed sustained unidirectional traveling chemical redox [NAD(P)H - NAD(P)(+)] waves within living polarized neutrophils. The present study shows that an intracellular metabolic wave responds to formyl peptide receptor agonists, but not antagonists, by splitting into two waves traveling in opposite directions along a cell's long axis. Similar effects were noted with other neutrophil-activating substances. Moreover, when cells were exposed to an N-formyl-methionyl-leucyl-phenylalanine (FMLP) gradient whose source was perpendicular to the cell's long axis, cell metabolism was locally perturbed with reorientation of the pattern in a direction perpendicular to the initial cellular axis. Thus, extracellular activating signals and the signals' spatial cues are translated into distinct intracellular dissipative structures.


Figures

Figure 1
Figure 1
Fluorescence microscopy studies of neutrophils. (Sequence 1) A time sequence of NAD(P)H fluorescence images of a polarized neutrophil are shown. The cell's leading edge is oriented toward the top of each frame; the uropod is near the bottom. Each image was collected for 0.1 μs with a 100-ms interval between micrographs. Spatiotemporal variations in NAD(P)H intensity are shown. Fluorescent stripes appear to propagate from the uropod to the lamellipodium. FMLP was added uniformly to the sample at 50 nM. After ≈2 min, the wave undergoes splitting (frame 12). (n = 50) (magnification, ×980) Cells were also treated with a variety of biological response modifiers in rows 2–7. In row 2, cells were treated with IL-8 (50 ng/ml; n = 4) for 1 h. In rows 3 and 4, cells were exposed to immune complexes (10 μg/ml; n = 3) or PAF (10 μg/ml; n = 8) for 30 min, respectively. In row 5, cells were exposed to LTB4 (1 mg/ml; n = 3) for 1 h. Row 6 shows cells incubated with LPS (50 ng/ml; n = 4) for 30 min. Cells were treated with the cytokine combination IFN-γ (50 units/ml, 3 h) + IL-6 (25 mg/ml, 20 min), as described in ref. , in row 7 (n = 4). (×960)
Figure 2
Figure 2
Quantitative line profile analysis of wave splitting. Line profiles of the same cell at eight time points are shown as pixel intensity (0–255 gray levels) vs. pixel number. The intensity of each point was determined by summing the intensities for all pixels in a row (the pixel rows were perpendicular to the direction of cell orientation). Data were obtained from micrographs collected for 0.1 μs. Each panel is separated by 80 ms. Wave splitting is observed in C. The wave intensities are reduced in D–G. The waves overlap in J. (Bar = 100 gray levels.)
Figure 3
Figure 3
Asymmetric addition of FMLP correlates with perturbation and reorientation of metabolic patterns. Images were acquired for 10 ms with 100 ms between each frame. A time sequence of 30 NAD(P)H images of a PMA-primed neutrophil are shown. The cell's leading edge is oriented toward the lower right-hand corner of each frame; the uropod is near the upper left-hand corner. FMLP was applied to cells from a direction perpendicular to the direction of cell polarization (arrow in frame 12). Frames 1–11 show a unidirectional traveling wave. Frames 12–15 show a major perturbation in NAD(P)H fluorescence. By frame 22, the metabolism has become reorganized into two waves. (×1,120)
Figure 4
Figure 4
Metabolic perturbation during receptor ligation. NAD(P)H fluorescence (A and C) and Fl-FNLPNTL fluorescence (B) micrographs are shown. Images in A and C were collected for 2.5 ms with a 100-ms interval between frames. In B, the images were collected for 2.5 ms each, but the interval time varied to illustrate the injection, dissipation, and labeling with the Fl-FNLPNTL, a fluorescent FPR agonist (total time is ≈1 min). (A) In the absence of extracellular perturbation, singular traveling waves are observed. (B) A micropipet was charged with 50 nM Fl-FNLPNTL. The micropipet's tip was brought to within a few μm of a polarized and PMA-primed neutrophil. A small quantity of Fl-FNLPNTL was expelled toward the cell's side (arrow in frames 1 and 7). Fl-FNLPNTL preferentially labeled the membrane near the pipet (frame 7). (C) The NAD(P)H intensity pattern realigned to match the region of Fl-FNLPNTL binding (2.5 ms per image with a 100-ms interval between images. Moreover, two NAD(P)H waves are now observed. The direction of FMLP injection is given by the arrow in frame 1. (The increase in the noise of C compared with A is because of the reduction in the waves' intensity.) (n = 17; ×890.)

References

    1. Schroedinger E. What is Life? Cambridge, U.K.: Cambridge Univ. Press; 1944.
    1. Nicolis G, Prigogine I. Exploring Complexity. New York: Freeman; 1989.
    1. Scott S K. Oscillations, Waves, and Chaos in Chemical Kinetics. Oxford, U.K.: Oxford Univ. Press; 1994.
    1. Imbihl R, Ertl G. Chem Rev. 1995;95:697–733.
    1. Goldbeter A. Biochemical Oscillations and Cellular Rhythms. Cambridge, U.K.: Cambridge Univ. Press; 1996.

Publication types

MeSH terms

LinkOut - more resources