. 2001 Mar 13;98(6):3446-53.
doi: 10.1073/pnas.061629598.

Appetite of an epiphyte: quantitative monitoring of bacterial sugar consumption in the phyllosphere

Affiliations

Appetite of an epiphyte: quantitative monitoring of bacterial sugar consumption in the phyllosphere

J H Leveau et al. Proc Natl Acad Sci U S A. .

Abstract

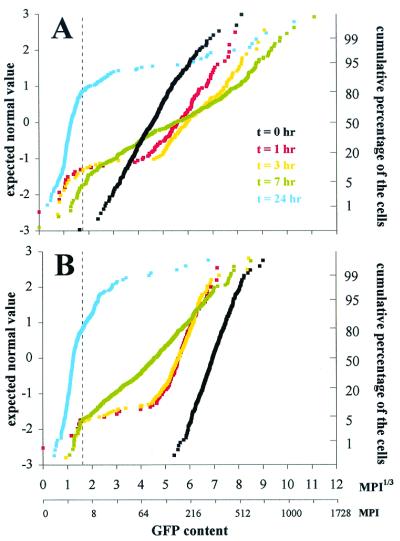
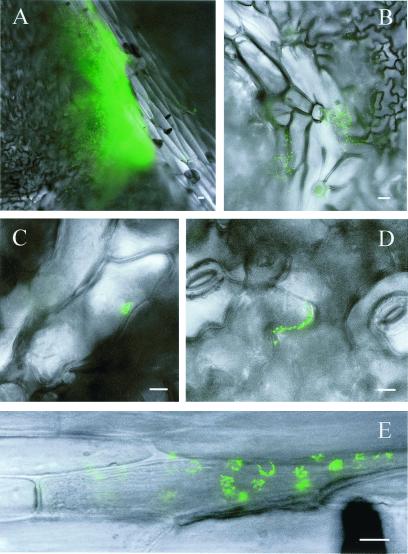
We report here the construction, characterization, and application of a bacterial bioreporter for fructose and sucrose that was designed to monitor the availability of these sugars to microbial colonizers of the phyllosphere. Plasmid pP(fruB)-gfp[AAV] carries the Escherichia coli fruB promoter upstream from the gfp[AAV] allele that codes for an unstable variant of green fluorescent protein (GFP). In Erwinia herbicola, this plasmid brings about the accumulation of GFP fluorescence in response to both fructose and sucrose. Cells of E. herbicola (pP(fruB)-gfp[AAV]) were sprayed onto bean plants, recovered from leaves at various time intervals after inoculation, and analyzed individually for GFP content by quantitative analysis of digital microscope images. We observed a positive correlation between single-cell GFP accumulation and ribosomal content as determined by fluorescence in situ hybridization, indicating that foliar growth of E. herbicola occurred at the expense of fructose and/or sucrose. One hour after inoculation, nearly all bioreporter cells appeared to be actively engaged in fructose consumption. This fraction dropped to approximately 11% after 7 h and to approximately 1% a day after inoculation. This pattern suggests a highly heterogeneous availability of fructose to individual E. herbicola cells as they colonize the phyllosphere. We estimated that individual cells were exposed to local initial fructose abundances ranging from less than 0.15 pg fructose to more than 4.6 pg.


Figures

Figure 1
Figure 1
Accumulation of GFP fluorescence in single cells of Eh299R carrying plasmid pPfruB-gfp[AAV]. At t = 0, a galactose-grown culture (with an optical density of 1.0) was diluted 120-fold into the same medium supplemented with fructose at initial concentrations of 0, 1.67, 16.7, or 167 μM.
Figure 2
Figure 2
Distribution profiles of single-cell GFP content in Eh299R (pPfruB-gfp[AAV]) cells from cultures that were supplemented with 0 or 167 μM fructose. See text for details. Note that due to the nature of the cube-root transformation, the MPI1/3 axis disproportionally overrepresents low values. An auxiliary axis shows corresponding MPI values. The broken lines in C mark the limit of GFP detection: MPI1/3 values above this limit were significantly different from background fluorescence (see Materials and Methods).
Figure 3
Figure 3
Dynamics of single-cell GFP accumulation in growing cultures of Eh299R (pPfruB-gfp[AAV]) in response to different fructose concentrations. See the legend to Fig. 1 for induction conditions. The gray distribution curves in A represent the population at t = 0 and serve as a reference.
Figure 4
Figure 4
Correlation between ribosome content and growth rate of a Eh299R (pPfruB-gfp[AAV]) culture in minimal medium on galactose. Shown as a function of time are cell density (□) and average single-cell TAMRA-fluorescence intensity (■). The solid curve represents the change in growth rate as estimated from the slope of the growth curve (μmax = 0.71 h−1).
Figure 5
Figure 5
Scatter plot of GFP and TAMRA fluorescence for individual cells from epiphytic populations of Eh299R (pPfruB-gfp[AAV]) that were recovered from leaves 1, 3, 7, and 24 h after inoculation (t = 0). The gray scatter in BE refers to the inoculum population. Because we observed no major differences in the distribution patterns among three leaves taken at each time point, we grouped, analyzed, and presented the data as if they were obtained from a single leaf. Broken lines indicate the limit of GFP detection.
Figure 6
Figure 6
Normal probability plots of GFP fluorescence in single cells from epiphytic populations of Eh299R harboring pPfruB-gfp[AAV] (A) or pPnptII-gfp[AAV] (B). See text for details. Broken lines indicate the limit of GFP detection.
Figure 7
Figure 7
In situ observations of fructose consumption by Eh299R (pPfruB-gfp[AAV]) in the phyllosphere. Descriptions are given in the text. The bar in each photograph represents a distance of 10 μm.

References

    1. Ruinen J. Plant Soil. 1961;15:81–109.
    1. Ellis R J, Thompson I P, Bailey M J. FEMS Microbiol Ecol. 1999;28:345–356.
    1. Hirano S S, Upper C D. Appl Environ Microbiol. 1989;55:623–630. - PMC - PubMed
    1. Kinkel L L, Wilson M, Lindow S E. Microb Ecol. 2000;39:1–11. - PubMed
    1. Kinkel L L. Annu Rev Phytopathol. 1997;35:327–347. - PubMed

Publication types

LinkOut - more resources