

Plasticity of the cochleotopic (frequency) map in specialized and nonspecialized auditory cortices
- PMID: 11248108
- PMCID: PMC30683
- DOI: 10.1073/pnas.061021698
Plasticity of the cochleotopic (frequency) map in specialized and nonspecialized auditory cortices
Abstract
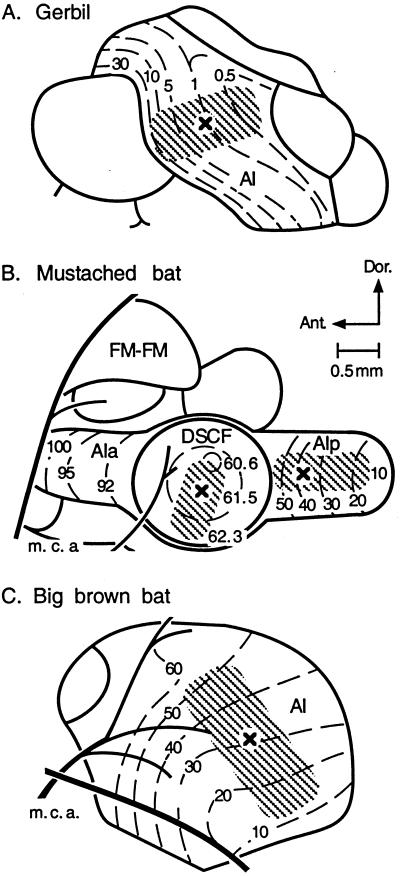
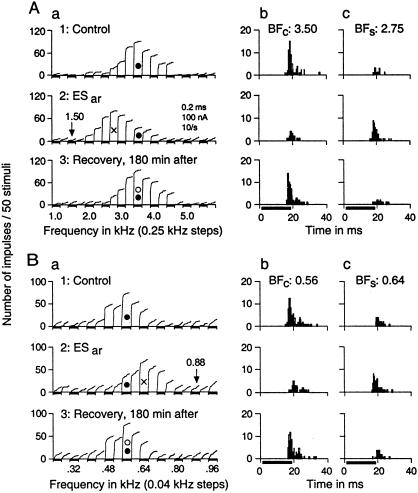
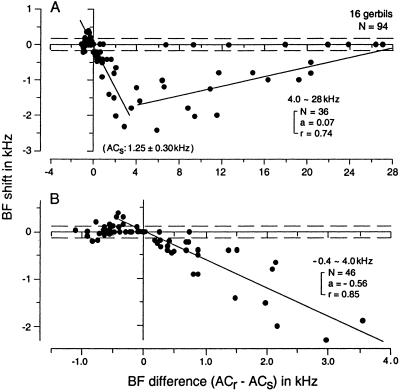
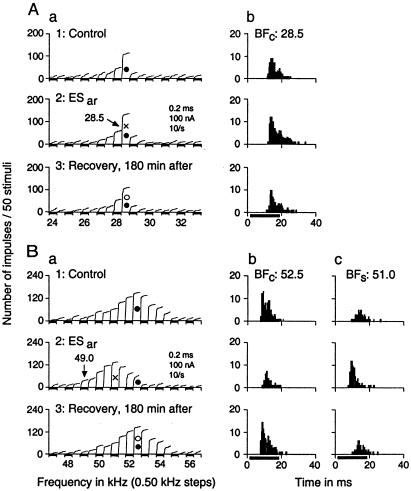
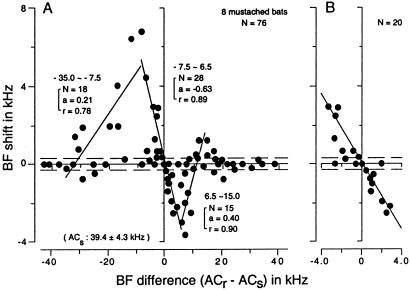
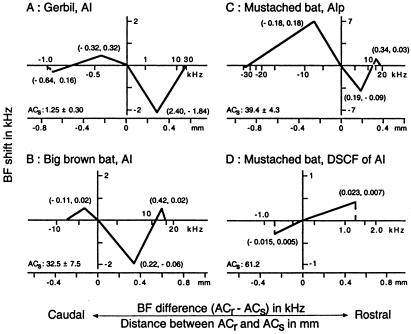
Auditory conditioning (associative learning) causes reorganization of the cochleotopic (frequency) maps of the primary auditory cortex (AI) and the inferior colliculus. Focal electric stimulation of the AI also evokes basically the same cortical and collicular reorganization as that caused by conditioning. Therefore, part of the neural mechanism for the plasticity of the central auditory system caused by conditioning can be explored by focal electric stimulation of the AI. The reorganization is due to shifts in best frequencies (BFs) together with shifts in frequency-tuning curves of single neurons. In the AI of the Mongolian gerbil (Meriones unguiculatus) and the posterior division of the AI of the mustached bat (Pteronotus parnellii), focal electric stimulation evokes BF shifts of cortical auditory neurons located within a 0.7-mm distance along the frequency axis. The amount and direction of BF shift differ depending on the relationship in BF between stimulated and recorded neurons, and between the gerbil and mustached bat. Comparison in BF shift between different mammalian species and between different cortical areas of a single species indicates that BF shift toward the BF of electrically stimulated cortical neurons (centripetal BF shift) is common in the AI, whereas BF shift away from the BF of electrically stimulated cortical neurons (centrifugal BF shift) is special. Therefore, we propose a hypothesis that reorganization, and accordingly organization, of cortical auditory areas caused by associative learning can be quite different between specialized and nonspecialized (ordinary) areas of the auditory cortex.
Figures
Similar articles
-
Centripetal and centrifugal reorganizations of frequency map of auditory cortex in gerbils.Proc Natl Acad Sci U S A. 2002 May 14;99(10):7108-12. doi: 10.1073/pnas.102165399. Epub 2002 May 7. Proc Natl Acad Sci U S A. 2002. PMID: 11997468 Free PMC article.
-
Reorganization of the cochleotopic map in the bat's auditory system by inhibition.Proc Natl Acad Sci U S A. 2002 Nov 26;99(24):15743-8. doi: 10.1073/pnas.242606699. Epub 2002 Nov 5. Proc Natl Acad Sci U S A. 2002. PMID: 12419852 Free PMC article.
-
Lateral inhibition for center-surround reorganization of the frequency map of bat auditory cortex.J Neurophysiol. 2004 Dec;92(6):3192-9. doi: 10.1152/jn.00301.2004. J Neurophysiol. 2004. PMID: 15548634
-
Plasticity of the adult auditory system based on corticocortical and corticofugal modulations.Neurosci Biobehav Rev. 2020 Jun;113:461-478. doi: 10.1016/j.neubiorev.2020.03.021. Epub 2020 Mar 21. Neurosci Biobehav Rev. 2020. PMID: 32209362 Review.
-
Anatomical connections suitable for the direct processing of neuronal information of different modalities via the rodent primary auditory cortex.Hear Res. 2009 Dec;258(1-2):16-27. doi: 10.1016/j.heares.2009.04.021. Epub 2009 May 13. Hear Res. 2009. PMID: 19446016 Review.
Cited by
-
Bilateral cortical interaction: modulation of delay-tuned neurons in the contralateral auditory cortex.J Neurosci. 2007 Aug 1;27(31):8405-13. doi: 10.1523/JNEUROSCI.1257-07.2007. J Neurosci. 2007. PMID: 17670987 Free PMC article.
-
Centripetal and centrifugal reorganizations of frequency map of auditory cortex in gerbils.Proc Natl Acad Sci U S A. 2002 May 14;99(10):7108-12. doi: 10.1073/pnas.102165399. Epub 2002 May 7. Proc Natl Acad Sci U S A. 2002. PMID: 11997468 Free PMC article.
-
Corticofugal modulation of duration-tuned neurons in the midbrain auditory nucleus in bats.Proc Natl Acad Sci U S A. 2001 Nov 20;98(24):14060-5. doi: 10.1073/pnas.241517098. Epub 2001 Nov 13. Proc Natl Acad Sci U S A. 2001. PMID: 11707597 Free PMC article.
-
Reorganization of the cochleotopic map in the bat's auditory system by inhibition.Proc Natl Acad Sci U S A. 2002 Nov 26;99(24):15743-8. doi: 10.1073/pnas.242606699. Epub 2002 Nov 5. Proc Natl Acad Sci U S A. 2002. PMID: 12419852 Free PMC article.
-
Excitation and inhibition jointly regulate cortical reorganization in adult rats.J Neurosci. 2008 Nov 19;28(47):12284-93. doi: 10.1523/JNEUROSCI.1952-08.2008. J Neurosci. 2008. PMID: 19020022 Free PMC article.
References
Publication types
MeSH terms
Grants and funding
LinkOut - more resources
Full Text Sources
Miscellaneous
