. 2001 Mar 15;20(6):1310-9.
doi: 10.1093/emboj/20.6.1310.

Adenovirus-activated PKA and p38/MAPK pathways boost microtubule-mediated nuclear targeting of virus

Affiliations

Adenovirus-activated PKA and p38/MAPK pathways boost microtubule-mediated nuclear targeting of virus

M Suomalainen et al. EMBO J. .

Abstract

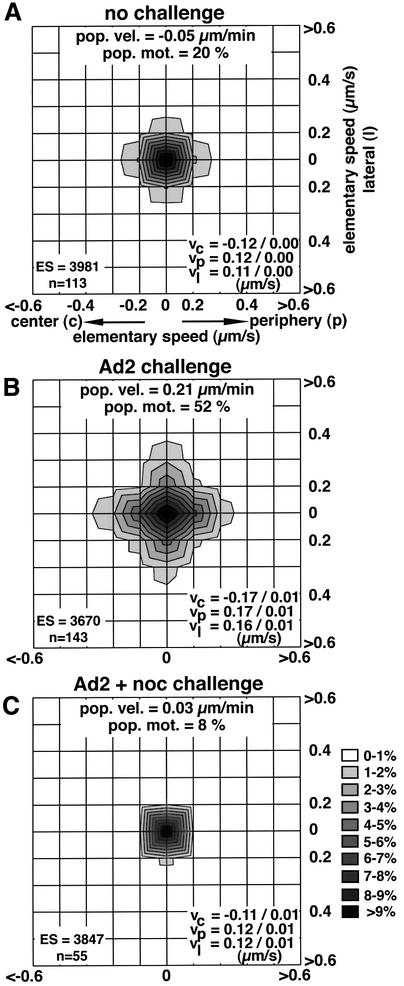
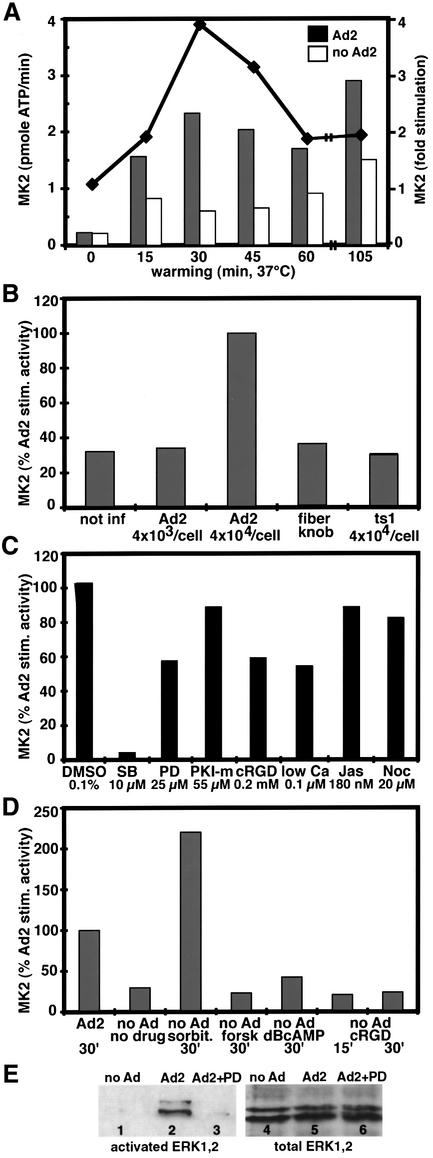
Nuclear targeting of adenovirus is mediated by the microtubule-dependent, minus-end-directed motor complex dynein/dynactin, in competition with plus- end-directed motility. We demonstrate that adenovirus transiently activates two distinct signaling pathways to enhance nuclear targeting. The first pathway activates integrins and cAMP-dependent protein kinase A (PKA). The second pathway activates the p38/MAP kinase and the downstream MAPKAP kinase 2 (MK2), dependent on the p38/MAPK kinase MKK6, but independent of integrins and PKA. Motility measurements in PKA-inhibited, p38-inhibited or MK2-lacking (MK2(-/-)) cells indicate that PKA and p38 stimulated both the frequency and velocity of minus-end-directed viral motility without affecting the perinuclear localization of transferrin-containing endosomal vesicles. p38 also suppressed lateral viral motilities and MK2 boosted the frequency of minus-end-directed virus transport. Nuclear targeting of adenovirus was rescued in MK2(-/-) cells by overexpression of hsp27, an MK2 target that enhances actin metabolism. Our results demonstrate that complementary activities of PKA, p38 and MK2 tip the transport balance of adenovirus towards the nucleus and thus enhance infection.


Figures

None
Fig. 1. Ad2 infection stimulates microtubule-dependent motility of cytosolic microinjected Ad2 particles. Microinjected Ad2–TR was analyzed by time-lapse fluorescence microscopy and ES were analyzed for each particle (n) in control HeLa cells (A), HeLa cells challenged with a normal Ad2 infection (B) or with Ad2 plus nocodazole (C). Population velocities, population motilities, average vectorial velocities to the center (vc), the periphery (vp) and lateral directions (vl) were determined based on the number of ES from n particles. Supplementary animation is available at The EMBO Journal Online.
None
Fig. 2. Nuclear targeting and DNA import of Ad2 are blocked by PKA inhibitors. (A) Control or PKI-myr-treated HeLa cells were infected with Ad2–TR for 70 min (a and b, red) or with unlabeled Ad2 for 180 min (c and d), fixed and processed for tubulin staining (a and b, green) or for FISH analysis of viral DNA (red) using lamins A, B, C (green) as nuclear envelope markers (c and d). The entire stack of Ad2–TR images is shown in (a) and (b). Three merged optical sections from comparable z-regions of the cells are shown for viral DNA (c and d). Clustering of Ad2–TR in the periphery of PKI-myr-treated cells is highlighted by arrows. Note the cytoplasmic background staining of the lamins in the FISH assays (c and d). Scale bar = 10 µm. (B) Quantification of the subcellular localization of Ad2–TR. Control cells and cells pre-treated with PKI-myr or myristoylated autocamptide (atc-m) were infected with Ad2–TR for 0, 60 or 120 min, followed by washout of PKI-myr and subsequent incubation in drug-free medium containing forskolin (forsk) and IBMX as indicated. The mean values of TR fluorescence in the cell periphery, the cytoplasm and the nuclear areas are indicated, including the SEM, p values and the number of cells analyzed (n).
None
Fig. 3. Transient activation of PKA by incoming Ad2 requires cell surface integrins. Drug-treated or control HeLa cells were incubated in the cold with 6 × 10⁴ Ad2 particles per cell (or as indicated) for 1 h, washed with virus-free medium and warmed up for different times. Kemptide phosphorylations (representing PKA activity) were determined in cell lysates at 15 min p.i. and normalized to the total cAMP-induced kemptide phosphorylations. (A) PKA stimulation by Ad2 is transient and peaks at 15 min p.i. Phospho-kemptide amounts are indicated as the mean values (left axis) including the SEM and number of independent experiments (n). Fold activation of infected (dark bars) over non-infected (light bars) cells is indicated by the solid line. (B) Ad2-stimulated PKA activation amounts to ∼3% of the total cellular PKA activity and is comparable to the levels in forskolin-stimulated HeLa cells, which can be boosted by the diesterase inhibitor IBMX. Recombinant PKI added to the cell lysates reduced both Ad2- and cAMP-stimulated kemptide phosphorylations to near background levels. (C) PKA activation is dependent on Ad2 particle dose (p/cell) and diminished by pre-incubating cells with the PKA inhibitor H89. The Ad2 mutant ts1 fails to stimulate kemptide phosphorylation. (D) cRGD or low-calcium medium, but not the PKC inhibitor calphostin (calph), the MEK inhibitor PD or nocodazole block Ad2-induced kemptide phosphorylation.
None
Fig. 4. Nuclear targeting of Ad2 requires MKK6-activated p38 and the downstream p38 targets MK2 and hsp27. (A) Control, SB- or PD-treated HeLa cells were infected with Ad2–TR for 70 min (a, c and e, red) in the presence of transferrin–FITC (tfn at 20 µg/ml from 40 to 60 min p.i., b and d), fixed with paraformaldehyde and analyzed by CLSM. Projections of all the optical sections are shown. One corresponding differential interference contrast image (DIC) is shown in (f). Scale bar = 10 µm. (B) Quantification of the subcellular localization of Ad2–TR in serum-starved control cells and cells pre-treated with SB (10 µM). HeLa cells were infected with Ad2–TR for 0, 90 or 140 min, followed by washout of SB and subsequent incubation in drug-free medium containing sorbitol (0.4 M). The mean values of TR fluorescence in the cell periphery, the cytoplasm and the nuclear area are indicated, including the SEM, p values and the number of cells analyzed. (C) Dominant-negative (dn) and constitutively active MKK6 block Ad2 nuclear targeting. HeLa cells were transfected with plasmids encoding constitutively active MKK6 (2E), constitutively active MEK1 (2E) and dn MKK6 (K82A) in the presence of limiting amounts of eGFP plasmid DNA. Ad2–TR fluorescence was quantitated in eGFP-positive cells. (D) Quantification of the subcellular localization of Ad2–TR in MK2+/+, MK2–/– and MK2–/– cells transfected with plasmids encoding a myc-tagged hsp27 or a myc-tagged hsp27-3D. Cells were infected with Ad2–TR for 70 min, stained for the myc tag using Alexa488-labeled anti-mouse IgG and processed for subcellular analysis of Ad2–TR.
None
Fig. 5. Transient activation of MK2 by incoming Ad2 originates at the cell surface independent of integrins. Drug-treated or control HeLa cells were incubated in the cold with 4 × 10⁴ Ad2 particles per cell (or as indicated) for 1 h, washed and warmed up for different times. Immunoisolated MK2 activity was determined at 30 min p.i. or as indicated and activity expressed as pmoles of [γ-32P]ATP incorporated/min or fold activation over non-infected cultures. (A) MK2 stimulation by Ad2 is transient, peaking at 30 min, and detectable at least up to 105 min p.i. (B) Dose-dependent activation of MK2 by wild-type but not the mutant Ad2 ts1. (C) MK2 activation is blocked by SB (10 µM), but not by PD (25 µM), PKI-myr (55 µM), cRGD peptides (0.2 mM), low calcium (0.1 µM), jasplakinolide (Jas; 180 nM) or nocodazole (Noc, 20 µM). (D) Ad2-induced MK2 activity is in the range of hypertonic stress-induced MK2 activity, but no MK2 induction occurred by forskolin (forsk, 5 µM), dBcAMP (1 µM) or cRGD (0.2 mM) alone. (E) Ad2 induces PD-sensitive ERK1,2/MAPK phosphorylations. HeLa cells were treated with or without PD, infected with Ad2 for 15 min, and cell lysates were analyzed for phosphorylated and total ERK1,2 by western blotting.
None
Fig. 6. Motility analysis of Ad2–TR in HeLa cells treated with PKA or p38 inhibitors and in MK2+/+ and MK2–/– mouse embryo fibroblasts. Ad2–TR was imaged in time-lapse mode and ES analyzed for each particle (n) in control or inhibitor-treated HeLa cells at 20–60 min p.i., and in mouse embryo fibroblasts at 30–45 min p.i. Population velocities, population motilities and the average fractions of the vectorial ES components (mot c and mot p) were determined as described in Materials and methods. vc and vp (mean/SEM) are the average vectorial velocity components to and from the center for each particle, respectively. vl depicts the mean lateral vectorial velocity and 2 vl/(vc + vp) is the relative fraction of the average lateral speeds. Light gray (HeLa cells) and dark gray shaded values (mouse MK2 cells) indicate significant differences (p <0.05) to the control HeLa cells (no drug) and MK2+/+ cells, respectively. Note that the sum of mot c plus mot p approximates but is not identical to the population motility. Supplementary animation is available at The EMBO Journal Online.

Similar articles

Cited by

References

    1. Alessi D.R., Cuenda,A., Cohen,P., Dudley,D.T. and Saltiel,A.R. (1995) PD 098059 is a specific inhibitor of the activation of mitogen-activated protein kinase kinase in vitro and in vivo. J. Biol. Chem., 270, 27489–27494. - PubMed
    1. Bergelson J.M., Cunningham,J.A., Droguett,G., Kurt-Jones,E.A., Krithivas,A., Hong,J.S., Horwitz,M.S., Crowell,R.L. and Finberg,R.W. (1997) Isolation of a common receptor for Coxsackie B viruses and adenoviruses 2 and 5. Science, 275, 1320–1323. - PubMed
    1. Beyaert R., Cuenda,A., Vanden Berghe,W., Plaisance,S., Lee,J.C., Haegeman,G., Cohen,P. and Fiers,W. (1996) The p38/RK mitogen-activated protein kinase pathway regulates interleukin-6 synthesis response to tumor necrosis factor. EMBO J., 15, 1914–1923. - PMC - PubMed
    1. Bruder J.T. and Kovesdi,I. (1997) Adenovirus infection stimulates the Raf/Mapk signaling pathway and induces interleukin-8 expression. J. Virol., 71, 398–404. - PMC - PubMed
    1. De Vos K., Severin,F., Van Herreweghe,F., Vancompernolle,K., Goossens,V., Hyman,A. and Grooten,J. (2000) Tumor necrosis factor induces hyperphosphorylation of kinesin light chain and inhibits kinesin-mediated transport of mitochondria. J. Cell Biol., 149, 1207–1214. - PMC - PubMed

Publication types

MeSH terms

Substances