. 2001 Mar 15;531(Pt 3):677-91.
doi: 10.1111/j.1469-7793.2001.0677h.x.

Phasic mechanoreceptor stimuli can induce phasic activation of upper airway muscles in humans

Affiliations

Phasic mechanoreceptor stimuli can induce phasic activation of upper airway muscles in humans

T Akahoshi et al. J Physiol. .

Abstract

1. Upper airway dilator muscles are phasically activated throughout breathing by respiratory pattern generator neurons. Studies have shown that non-physiological upper airway mechanoreceptive stimuli (e.g. rapidly imposed pulses of negative pressure) also activate these muscles. Such reflexes may become activated during conditions that alter airway resistance in order to stabilise airway patency. 2. To determine the contribution of ongoing mechanoreceptive reflexes to phasic activity of airway dilators, we assessed genioglossal electromyogram (GG EMG: rectified with moving time average of 100 ms) during slow (physiological) oscillations in negative pressure generated spontaneously and passively (negative pressure ventilator). 3. Nineteen healthy adults were studied while awake, during passive mechanical ventilation across normal physiological ranges of breathing rates (13-19 breaths min-1) and volumes (0.5-1.0 l) and during spontaneous breathing across the physiological range of end-tidal carbon dioxide (PET,CO2; 32-45 mmHg). 4. Within-breath phasic changes in airway mechanoreceptor stimuli (negative pressure or flow) were highly correlated with within-breath phasic genioglossal activation, probably representing a robust mechanoreceptive reflex. These reflex relationships were largely unchanged by alterations in central drive to respiratory pump muscles or the rate of mechanical ventilation within the ranges studied. A multivariate model revealed that tonic GG EMG, PET,CO2 and breath duration provided no significant independent information in the prediction of inspiratory peak GG EMG beyond that provided by epiglottic pressure, which alone explained 93 % of the variation in peak GG EMG across all conditions. The overall relationship was: Peak GG EMG = 79.7 - (11.3 X Peak epiglottic pressure), where GG EMG is measured as percentage of baseline, and epiglottic pressure is in cmH2O. 5. These data provide strong evidence that upper airway dilator muscles can be activated throughout inspiration via ongoing mechanoreceptor reflexes. Such a feedback mechanism is likely to be active on a within-breath basis to protect upper airway patency in awake humans. This mechanism could mediate the increased genioglossal activity observed in patients with obstructive sleep apnoea (i.e. reflex compensation for an anatomically smaller airway).


Figures

Figure 1
Figure 1. Negative pressure ventilation reduces inspiratory diaphragmatic activity
Mean data (±s.e.m., n = 5 subjects) for 5 conditions in experiment A. Phasic DIA EMG, mean inspiratory minus mean expiratory diaphragm electromyogram (from moving time averages). * Significant difference from eucapnic spontaneous breathing (P < 0.05).
Figure 2
Figure 2. Phasic inspiratory genioglossus activation persists during passive negative pressure ventilation
Examples of raw traces of breath-by-breath data from experiment A in one subject showing spontaneous breathing (left panel) and the six conditions of iron lung ventilation. Each panel shows diaphragm electromyogram (DIA EMG; upper traces), genioglossus electromyogram (GG EMG; middle traces) and epiglottic pressure (Pepi; lower traces (negative pressure upwards)). Note: (i) respiratory phasic DIA EMG was decreased during all six iron lung conditions compared to spontaneous breathing; (ii) increasing negative Pepi (right 3 panels) resulted in an increased respiratory phasic GG EMG; (iii) increasing breath duration (lower 2 panels) did not alter the relationship between negative Pepi and GG EMG; (iv) lowering PET,CO2 (lowest 4 panels) did not alter the relationship between negative Pepi and GG EMG. The inset (left) shows the averaged waveforms of inspiratory airflow (downwards), Pepi (negative upwards), and the moving time averages of GG EMG and DIA EMG during spontaneous breathing. Note: there is the pre-activation of GG EMG before the onset of inspiratory airflow, and thereafter, there is a very good within-breath correlation between GG EMG and both airflow and negative Pepi (but a poorer correlation between DIA EMG and either airflow or negative Pepi).
Figure 3
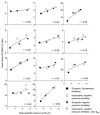
Figure 3. Peak intra-pharyngeal negative pressure predicts peak genioglossus activity in all subjects (experiment A; individual results)
In each subject, peak negative epiglottic pressure was highly correlated with peak phasic GG activation during all conditions (eucapnic spontaneous breathing; medium and high level negative pressure ventilation; hypocapnia and eucapnia; slow and rapid breathing frequencies). Not all subjects underwent all conditions.
Figure 4
Figure 4. Peak negative intra-pharyngeal pressure predicts peak genioglossus activity in all conditions
A, experiment A, group results. Mean values of the 5 subjects who completed all 7 conditions. Peak negative epiglottic negative pressure was highly correlated with peak phasic GG EMG during all conditions (spontaneous breathing; medium and high level negative pressure ventilation; slow and rapid breathing frequencies; hypocapnia and eucapnia; r = 0.97; P = 0.0002, n = 7 conditions). Analysis of 11 subjects who completed conditions 1–5 revealed a very similar robust relationship (r = 0.98; P = 0.0029, n = 5 conditions). B, experiment B, group results. Peak negative epiglottic pressure was highly correlated with peak phasic GG EMG during spontaneous breathing and negative pressure ventilation while eucapnic and hypercapnic (r = 0.96; P = 0.04, n = 4 conditions). Means ±s.e.m. (n = 8 subjects except for ‘Hypercapnia negative pressure ventilation’ where n = 7).
Figure 5
Figure 5. Relationship between negative airway pressure and genioglossus activity across inspiration
The group mean relationships between negative Pepi and GG EMG are shown for experiment A (A) and experiment B (B). Only the 5 conditions in which all 11 subjects participated are presented for A. In each condition there was a highly significant relationship between negative Pepi and GG EMG throughout inspiration. This can be seen both in the plot of both signals against time (upper panels) and in the x-y plots (lower panels). The mean slopes of the relationships between negative Pepi and GG EMG were very similar among conditions within each experiment (x and y scales have the same ratio among x-y plots). Nonetheless, there was invariably some degree of ‘hysteresis’ whereby GG EMG changed relatively more for a given change in negative Pepi early in inspiration. The hysteresis loops were generated in a clockwise direction throughout inspiration in each plot. A similar hysteresis was observed in all individual subjects’ data (not shown).
Figure 6
Figure 6. Robust relationship between airway negative pressure and genioglossus activity across early portion of inspiration during all 11 experimental conditions
The group mean relationships between negative Pepi and GG EMG are shown for experiment A (left panel: 7 conditions; means of 11 subjects) and experiment B (right panel: 4 conditions; means of 8 different subjects). In each condition there was a highly significant relationship between negative Pepi and GG EMG throughout the early portion of inspiration (i.e. until peak GG EMG). Moreover, the lines are virtually superimposed demonstrating that the slope of this relationship was almost identical among conditions (spontaneous breathing; medium and high level negative pressure ventilation; slow and rapid breathing frequencies; hypocapnia, eucapnia and hypercapnia). This suggests that a mechanoreceptive reflex is sufficient to explain the GG activity throughout inspiration across the physiological ranges of the variables that were studied. Note: in experiment B, the blue line started from a higher tonic GG EMG (not significant), but the slope of the relationship between negative epiglottic pressure and GG activity was still similar to the other conditions.

References

    1. Bartlett D, Sant'Ambrogio G, Wise JCM. Transduction properties of tracheal stretch receptors. Journal of Physiology. 1976;258:421–432. - PMC - PubMed
    1. Berry RB, McNellis MI, Kouchi K, Light RW. Upper airway anesthesia reduces phasic genioglossus activity during sleep apnea. American Journal of Respiratory and Critical Care Medicine. 1997;156:127–132. - PubMed
    1. Bianchi AL, Denavit-Saubie M, Champagnat J. Central control of breathing in mammals: neuronal circuitry, membrane properties, and neurotransmitters. Physiological Reviews. 1995;75:1–31. - PubMed
    1. Curran AK, Eastwood PR, Harms CA, Smith CA, Dempsey JA. Superior laryngeal nerve section alters responses to upper airway distortion in sleeping dogs. Journal of Applied Physiology. 1997;83:768–775. - PubMed
    1. Evans KC, Shea SA, Saykin AJ. Functional MRI localisation of central nervous system regions associated with volitional inspiration in humans. Journal of Physiology. 1999;520:383–392. - PMC - PubMed

Publication types

LinkOut - more resources