Comparative Study
. 2001 Mar;13(3):585-98.
doi: 10.1105/tpc.13.3.585.

Cell cycle in the fucus zygote parallels a somatic cell cycle but displays a unique translational regulation of cyclin-dependent kinases

Affiliations
Comparative Study

Cell cycle in the fucus zygote parallels a somatic cell cycle but displays a unique translational regulation of cyclin-dependent kinases

F Corellou et al. Plant Cell. 2001 Mar.

Abstract

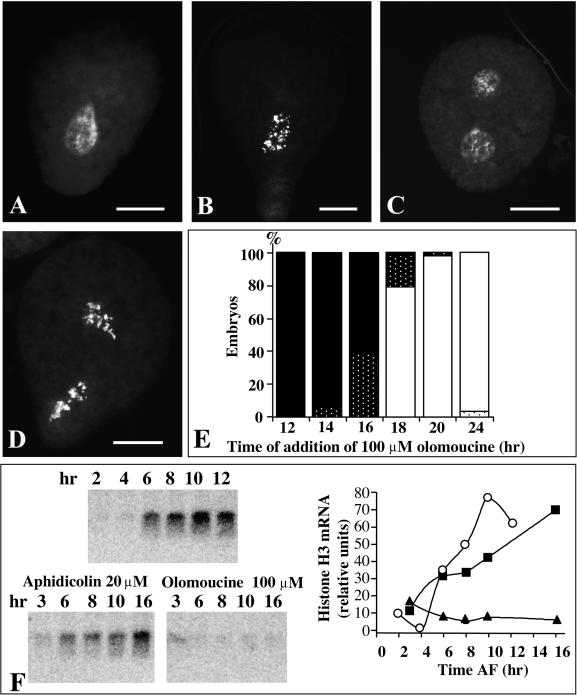
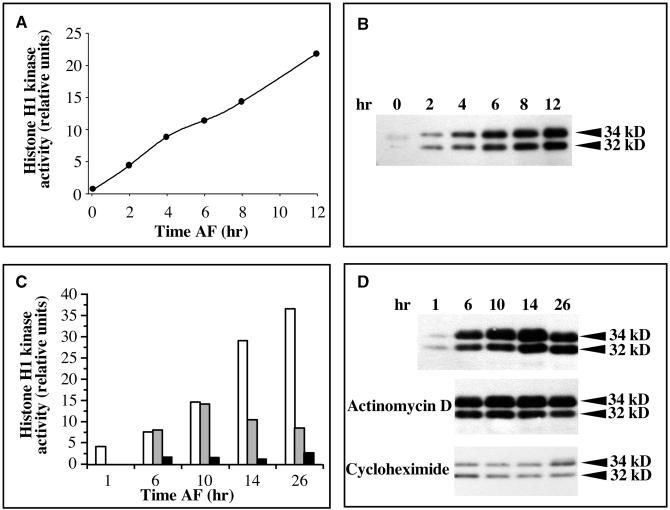
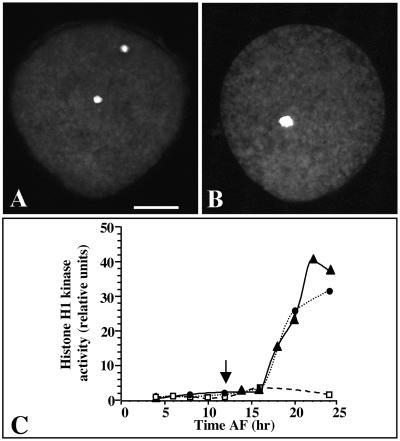
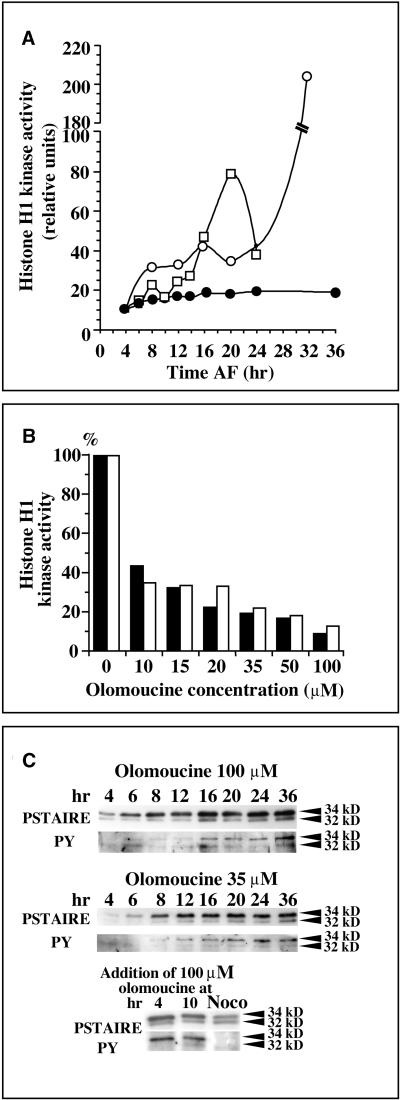
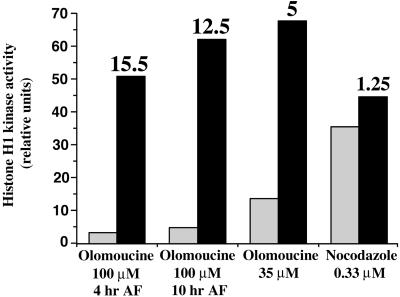
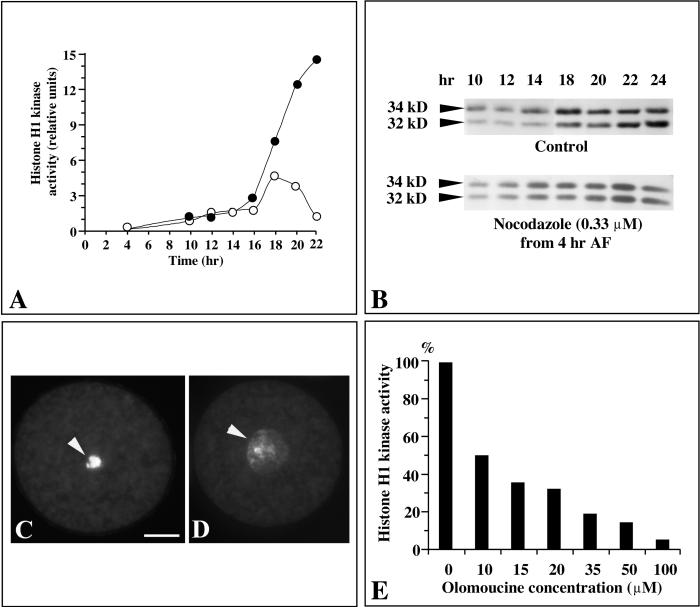
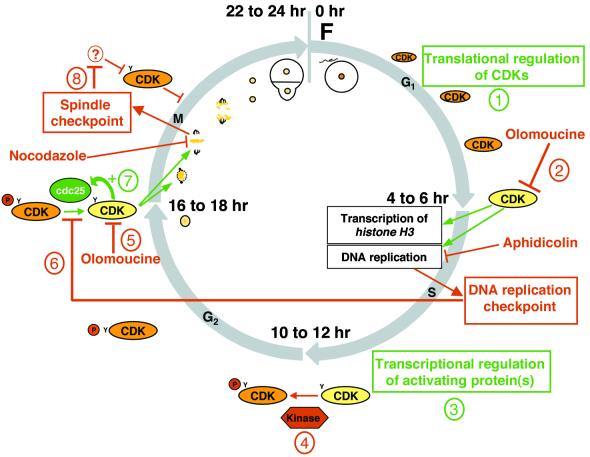
In eukaryotic cells, the basic machinery of cell cycle control is highly conserved. In particular, many cellular events during cell cycle progression are controlled by cyclin-dependent kinases (CDKs). The cell cycle in animal early embryos, however, differs substantially from that of somatic cells or yeasts. For example, cell cycle checkpoints that ensure that the sequence of cell cycle events is correct have been described in somatic cells and yeasts but are largely absent in embryonic cells. Furthermore, the regulation of CDKs is substantially different in the embryonic and somatic cells. In this study, we address the nature of the first cell cycle in the brown alga Fucus, which is evolutionarily distant from the model systems classically used for cell cycle studies in embryos. This cycle consists of well-defined G1, S, G2, and M phases. The purine derivative olomoucine inhibited CDKs activity in vivo and in vitro and induced different cell cycle arrests, including at the G1/S transition, suggesting that, as in somatic cells, CDKs tightly control cell cycle progression. The cell cycle of Fucus zygotes presented the other main features of a somatic cell cycle, such as a functional spindle assembly checkpoint that targets CDKs and the regulation of the early synthesis of two PSTAIRE CDKs, p32 and p34, and the associated histone H1 kinase activity as well as the regulation of CDKs by tyrosine phosphorylation. Surprisingly, the synthesis after fertilization of p32 and p34 was translationally regulated, a regulation not described previously for CDKs. Finally, our results suggest that the activation of mitotic CDKs relies on an autocatalytic amplification mechanism.


Figures

Figure 1.
Figure 1.
Effect of Olomoucine on Cell Cycle Progression in Zygotes. Olomoucine (100 μM) was added at various times until 36 hr AF. Cells were fixed and subsequently stained with mithramycin A ([A] to [D]). (A) to (D) Zygotes treated with 100 μM olomoucine from 12 (A), 16 (B), 20 (C), and 24 (D) hr until 36 hr AF. formula image. (E) Zygotes treated with 100 μM olomoucine at various times AF (x axis) displayed either one or two sets of dispersed chromosomes (white dots and black dots, respectively) or one or two decondensed nuclei (black bars and white bars, respectively). The data shown are representative of the results of two independent experiments. (F) RNA gel blot analysis with a Fucus histone H3 DNA probe (left). Equal amounts of RNA (10 μg), extracted at the times indicated, were loaded in each lane, and RNA integrity was checked by staining with ethidium bromide (data not shown). Corresponding quantifications (right) were performed with a phosphorimager in control zygotes (open circles) as well as in zygotes treated from 3 hr AF with either 20 μM aphidicolin (closed squares) or 100 μM olomoucine (closed triangles) until the times indicated on the x axis. The data shown are representative of the results of two independent experiments. AF, after fertilization.
Figure 2.
Figure 2.
Regulation of the Expression and Activity of CDKs during Early Development. Total proteins were extracted from Fucus zygotes at the times indicated, and CDKs were purified by affinity on p9CKShs1–Sepharose beads. The results shown are representative of the results of three independent experiments. Purified proteins were assayed for their ability to phosphorylate histone H1 in vitro ([A] and [C]). Eluted proteins were immunoblotted with an anti-PSTAIRE antibody ([B] and [D]). (A) Histone H1 kinase activity during normal development. (B) Synthesis of PSTAIRE CDKs during normal development. (C) Histone H1 kinase activity in extracts from zygotes treated from 1 hr AF with either 16 μM actinomycin D (gray bars) or 0.2 μM cycloheximide (black bars), compared with control cells (white bars). (D) Expression of PSTAIRE CDKs in extracts from zygotes treated from 1 hr AF with either 16 μM actinomycin D or 0.2 μM cycloheximide.
Figure 3.
Figure 3.
Effect of the Inhibition of Pronuclei Fusion by Nocodazole on the Activity of CDKs. (A) A zygote treated with 0.33 μM nocodazole from 2 to 36 hr AF and then stained with mithramycin A. (B) A zygote treated with 0.33 μM nocodazole from 12 to 36 hr AF and then stained with mithramycin A. (C) Histone H1 kinase activity in extracts from cells treated with 0.33 μM nocodazole from either 2 hr AF (closed circles) or 12 hr AF (closed triangles, arrow) until the times indicated on the x axis. Histone H1 kinase activity in extracts from control zygotes is represented by open squares. The data shown are representative of the results of two independent experiments. formula image.
Figure 4.
Figure 4.
Effect of Olomoucine on Histone H1 Kinase Activity and Tyrosine Phosphorylation of CDKs. (A) Histone H1 kinase activities in extracts from control zygotes (open squares) and zygotes treated from 3 hr AF with either 100 μM olomoucine (closed circles) or 35 μM olomoucine (open circles) until the times indicated on the x axis. The data shown are representative of the results of three independent experiments. (B) Dose-dependent in vitro inhibition by olomoucine of histone H1 kinase activity in extracts from cells treated from 3 to 36 hr AF with either 35 μM olomoucine (black bars) or 100 μM olomoucine (white bars). For each treatment, the kinase activity is reported as a percentage of control activity (no olomoucine). The data shown are representative of the results of two independent experiments. (C) Protein gel blot analysis of the expression and phosphorylation of PSTAIRE CDKs after treatment with olomoucine. Immunoblotting was performed with anti-PSTAIRE (PSTAIRE) or anti-phosphotyrosine (PY) antibodies. Top two panels, zygotes were treated from 3 hr AF with either 100 or 35 μM olomoucine until the times indicated (data shown are from the same experiment represented in [A]). Bottom panel, zygotes were treated from 4 or 10 hr AF with 100 μM olomoucine or with 0.33 μM nocodazole (Noco) until 36 hr AF. The data shown are representative of the results of three independent experiments.
Figure 5.
Figure 5.
In Vitro Activation of Histone H1 Kinase by the Human Phosphatase GST-cdc25A. Protein extracts from zygotes treated with olomoucine or nocodazole from the times indicated until 36 hr AF were assayed for histone H1 kinase activity after treatment with 62 units of GST-cdc25A for 20 min (black bars) or after incubation in the dephosphorylation buffer (gray bars). The relative degrees of activation by GST-cdc25A are indicated above the black bars. The data shown are representative of the results of two independent experiments.
Figure 6.
Figure 6.
A Spindle Assembly Checkpoint Targets Mitotic CDKs. (A) Histone H1 kinase activity in extracts from either control zygotes (open circles) or cells treated with 0.33 μM nocodazole from 4 hr AF (closed circles) until the times indicated on the x axis. The proportion of cells in mitosis was determined by staining DNA with mithramycin A. (B) Protein gel blot analysis of PSTAIRE CDKs in extracts from either control zygotes or zygotes treated with 0.33 μM nocodazole from 4 hr AF until the times indicated. (C) A zygote arrested in mitosis with 0.33 μM nocodazole from 6 to 36 hr AF, fixed, and stained with mithramycin A. Note the highly condensed and clustered chromosomes (arrowhead). (D) A zygote arrested in mitosis with 0.33 μM nocodazole from 6 to 36 hr AF (e.g., as in [C]), subsequently treated with both 100 μM olomoucine and 0.33 μM nocodazole for 6 hr, and finally fixed and stained with mithramycin A. Note the decondensed nucleus at 42 hr AF (arrowhead). (E) Dose-dependent in vitro inhibition by olomoucine of histone H1 kinase activity in extracts from cells treated with 0.33 μM nocodazole from 4 to 36 hr AF. Kinase activity is represented as a percentage of control activity (no olomoucine). The data shown are representative of the results of three independent experiments. formula image.
Figure 7.
Figure 7.
The First Cell Cycle and the Possible Roles and Regulations of CDKs in Fucoid Algae. This diagram is based on the results of this study and on those reported previously (Corellou et al., 2000a). Activating and inhibitory mechanisms are shown in red and green, respectively. Active and inactive CDKs are shown in orange and yellow, respectively. The first cell cycle comprises well-defined G1, S, G2, and M phases. (1) PSTAIRE CDKs are synthesized from maternal mRNAs after fertilization. (2) The CDK activity that is required for the G1/S transition is inhibited by olomoucine. The transcription of histone H3 in S phase is inhibited by olomoucine but not by aphidicolin. (3) Transcription, before 10 hr AF, of the genes encoding activating proteins is required for mitotic activity of CDKs. (4) CDKs are maintained inactive in G2 by inhibitory phosphorylation (P) on tyrosine residues (Y) and are activated in mitosis by a cdc25-like phosphatase. (5) Olomoucine, by inhibiting CDKs, prevents entry into and progression through mitosis. (6) A DNA replication checkpoint prevents mitosis, including chromatin condensation and spindle formation, through inactivation of mitotic CDKs by inhibitory phosphorylation. (7) The autocatalytic amplification of mitotic CDK activity (+), which may rely on the activation of a cdc25-like protein by CDKs, is inhibited by olomoucine (5). (8) A spindle assembly checkpoint prevents progression through mitosis, including chromatin decondensation, by inhibiting the inactivation of CDKs by an unknown mechanism (?). F, fertilization.

Comment in

  • A brief tour of the cell cycle.
    Eckardt NA. Eckardt NA. Plant Cell. 2001 Mar;13(3):449-51. doi: 10.1105/tpc.13.3.449. Plant Cell. 2001. PMID: 11251087 Free PMC article. No abstract available.

References

    1. Alessi, F., Quarta, S., Savio, M., Riva, F., Rossi, L., Stivala, L.A., Scovassi, A.I., Meijer, L., and Prosperi, E. (1998). The cyclin-dependent kinase inhibitors olomoucine and roscovitine arrest human fibroblasts in G1 phase by specific inhibition of CDK2 kinase activity. Exp. Cell Res. 245, 8–18. - PubMed
    1. Apt, K.E., and Grossman, A.R. (1993). Characterization and transcript analysis of the major phycobiliprotein subunit genes from Aglaothamnion neglectum (Rhodophyta). Plant Mol. Biol. 21, 27–38. - PubMed
    1. Arion, D., and Meijer, L. (1989). M-phase–specific protein kinase from mitotic sea urchin eggs: Cyclic activation depends on protein synthesis and phosphorylation but does not require DNA or RNA synthesis. Exp. Cell Res. 183, 361–375. - PubMed
    1. Arion, D., Meijer, L., Brizuela, L., and Beach, D. (1988). cdc2 is a component of the M phase–specific histone H1 kinase: Evidence for identity with MPF. Cell 55, 371–378. - PubMed
    1. Bell, M.H., Halford, N.G., Ormrod, J.C., and Francis, D. (1993). Tobacco plants transformed with cdc25, a mitotic inducer gene from fission yeast. Plant Mol. Biol. 23, 445–451. - PubMed

Publication types

MeSH terms

Associated data