NF-kappa B p50-dependent in vivo footprints at Ig S gamma 3 DNA are correlated with mu-->gamma 3 switch recombination
- PMID: 11254712
- PMCID: PMC4975043
- DOI: 10.4049/jimmunol.166.7.4552
NF-kappa B p50-dependent in vivo footprints at Ig S gamma 3 DNA are correlated with mu-->gamma 3 switch recombination
Abstract
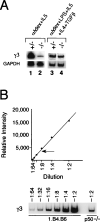
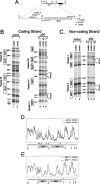
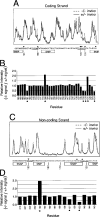
NF-kappa B has been demonstrated to play critical roles in multiple aspects of immune responses including Ig H chain isotype switching. To better define the specific roles the p50 subunit of NF-kappa B plays in mu-->gamma 3 switch recombination (SR), we systematically evaluated p50-deficient B cells for activities that are strongly correlated with SR. B cell activation with LPS plus anti-IgD-dextran plus IL-5 plus IL-4 plus TGF-beta produced normal levels of proliferation and gamma3 germline transcripts in p50-deficient B cells, but mu-->gamma 3 SR was impaired. In vitro binding studies previously showed that NF-kappa B p50 homodimer binds the switch nuclear B-site protein (SNIP) of the S gamma 3 tandem repeat. Ligation-mediated PCR in vivo footprint analysis demonstrates that the region spanning the SNIP and switch nuclear A-site protein (SNAP) binding sites of the S gamma 3 region are contacted by protein in normal resting splenic B cells. B cells that are homozygous for the targeted disruption of the gene encoding p50 (-/-) show strong aberrant footprints, whereas heterozygous cells (+/-) reveal a partial effect in S gamma 3 DNA. These studies provide evidence of nucleoprotein interactions at switch DNA in vivo and suggest a direct interaction of p50 with S gamma 3 DNA that is strongly correlated with SR competence.
Figures


Similar articles
-
Mapping of a functional recombination motif that defines isotype specificity for mu-->gamma3 switch recombination implicates NF-kappaB p50 as the isotype-specific switching factor.J Exp Med. 2004 Mar 1;199(5):617-27. doi: 10.1084/jem.20031935. J Exp Med. 2004. PMID: 14993249 Free PMC article.
-
NF-kappa B binds to the immunoglobulin S gamma 3 region in vivo during class switch recombination.Eur J Immunol. 2006 Dec;36(12):3315-23. doi: 10.1002/eji.200636294. Eur J Immunol. 2006. PMID: 17109470 Free PMC article.
-
B cells from p50/NF-kappa B knockout mice have selective defects in proliferation, differentiation, germ-line CH transcription, and Ig class switching.J Immunol. 1996 Jan 1;156(1):183-91. J Immunol. 1996. PMID: 8598461
-
Engagement of CD153 (CD30 ligand) by CD30+ T cells inhibits class switch DNA recombination and antibody production in human IgD+ IgM+ B cells.J Immunol. 2000 Jul 15;165(2):786-94. doi: 10.4049/jimmunol.165.2.786. J Immunol. 2000. PMID: 10878352 Free PMC article.
-
The evolutionarily conserved sequence upstream of the human Ig heavy chain S gamma 3 region is an inducible promoter: synergistic activation by CD40 ligand and IL-4 via cooperative NF-kappa B and STAT-6 binding sites.J Immunol. 1999 May 1;162(9):5327-36. J Immunol. 1999. PMID: 10228008
Cited by
-
Sgamma3 switch sequences function in place of endogenous Sgamma1 to mediate antibody class switching.J Exp Med. 2008 Jul 7;205(7):1567-72. doi: 10.1084/jem.20080451. Epub 2008 Jun 9. J Exp Med. 2008. PMID: 18541713 Free PMC article.
-
Expression of AID transgene is regulated in activated B cells but not in resting B cells and kidney.Mol Immunol. 2008 Apr;45(7):1883-92. doi: 10.1016/j.molimm.2007.10.041. Epub 2007 Dec 11. Mol Immunol. 2008. PMID: 18067961 Free PMC article.
-
Identification of murine B cell lines that undergo somatic hypermutation focused to A:T and G:C residues.Eur J Immunol. 2008 Jan;38(1):227-39. doi: 10.1002/eji.200737664. Eur J Immunol. 2008. PMID: 18081040 Free PMC article.
-
Switch region identity plays an important role in Ig class switch recombination.J Immunol. 2010 Jun 1;184(11):6242-8. doi: 10.4049/jimmunol.1000507. Epub 2010 Apr 28. J Immunol. 2010. PMID: 20427773 Free PMC article.
-
AID-dependent histone acetylation is detected in immunoglobulin S regions.J Exp Med. 2006 Jan 23;203(1):215-26. doi: 10.1084/jem.20051774. Epub 2006 Jan 17. J Exp Med. 2006. PMID: 16418396 Free PMC article.
References
-
- Gritzmacher CA. Molecular aspects of heavy-chain class switching. CRC Crit. Rev. Immunol. 1989;9:173. - PubMed
-
- Stavnezer J. Antibody class switching. Adv. Immunol. 1996;61:79. - PubMed
-
- von Schwedler U, Jack H-M, Wabl M. Circular DNA is a product of immunoglobulin class switch rearrangement. Nature. 1990;345:452. - PubMed
-
- Iwasato T, Shimizu A, Honjo T, Yamagishi H. Circular DNA is excised by immunoglobulin class switch recombination. Cell. 1990;62:143. - PubMed
Publication types
MeSH terms
Substances
Grants and funding
LinkOut - more resources
Full Text Sources
Molecular Biology Databases
Research Materials

