. 2001 Mar 19;193(6):727-40.
doi: 10.1084/jem.193.6.727.

Colony-stimulating factor 1 promotes progression of mammary tumors to malignancy

Affiliations

Colony-stimulating factor 1 promotes progression of mammary tumors to malignancy

E Y Lin et al. J Exp Med. .

Abstract

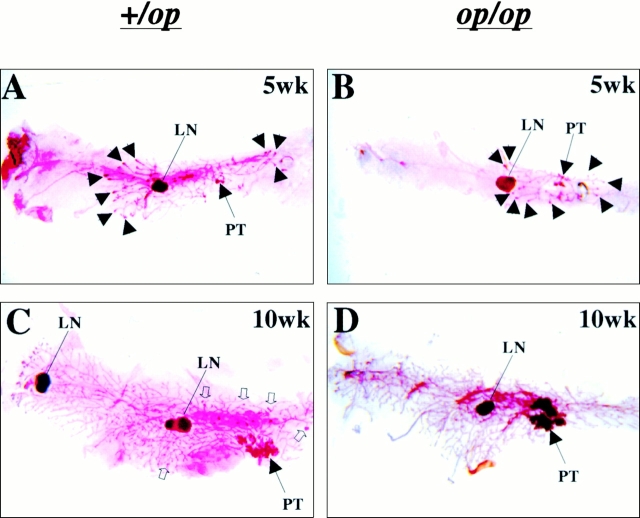
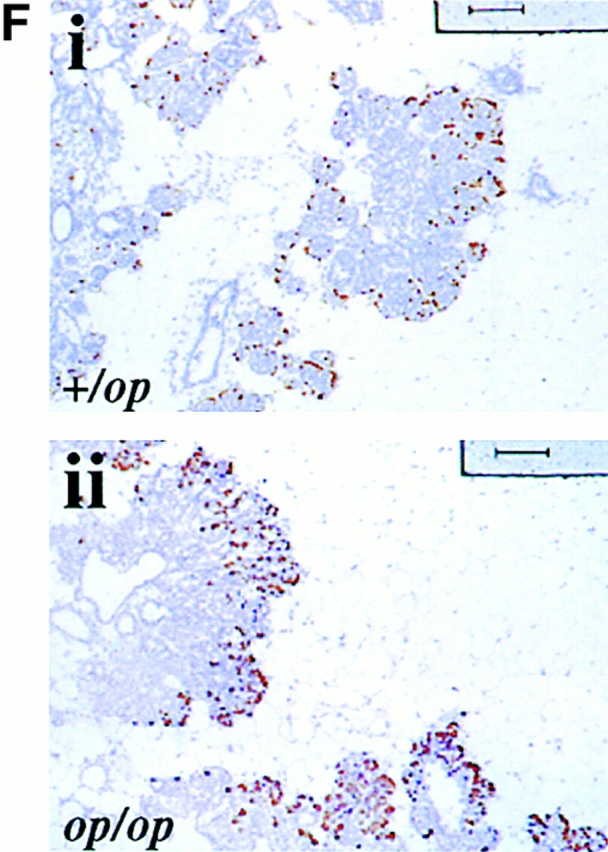
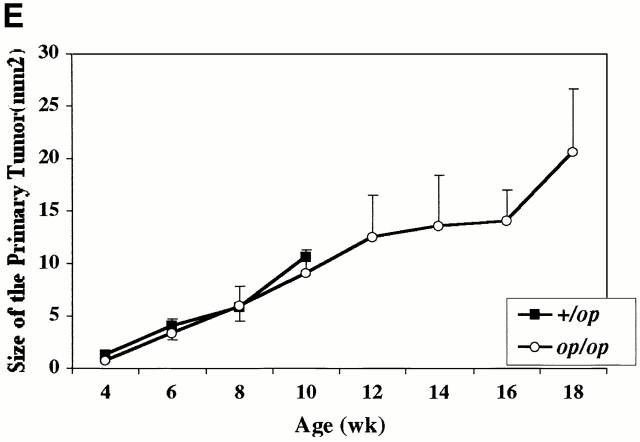
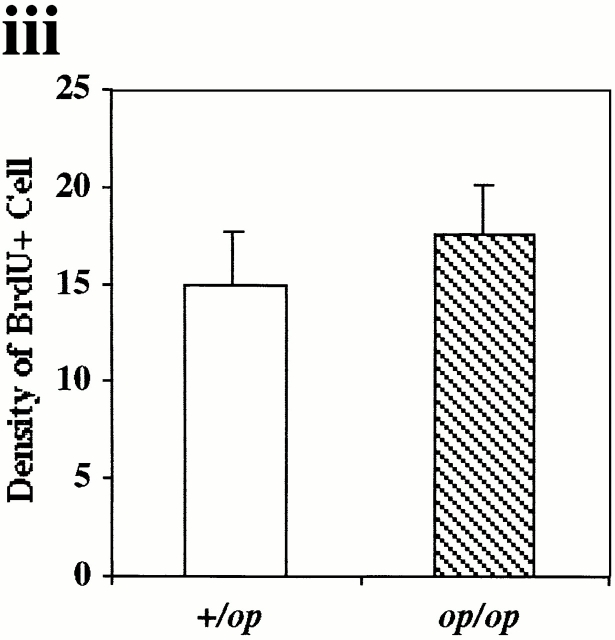
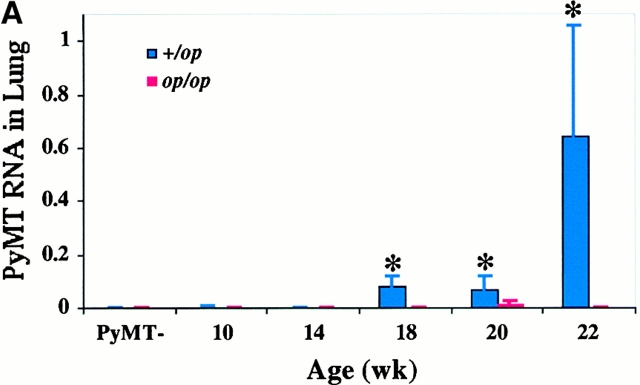
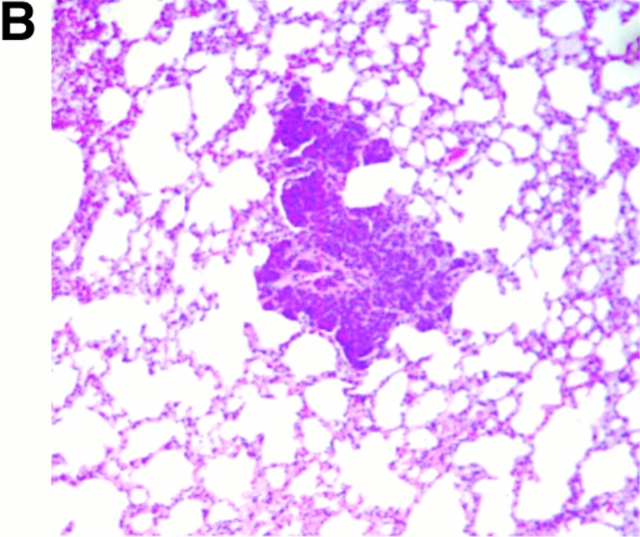
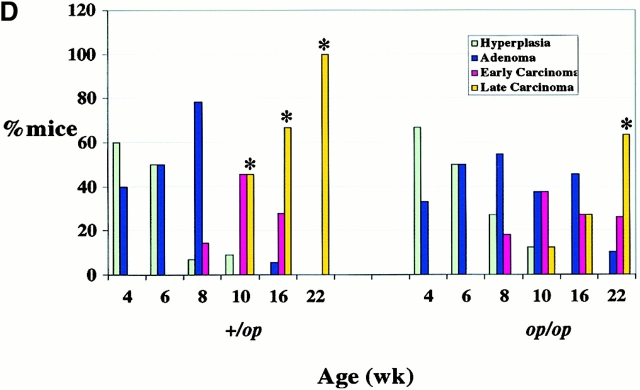
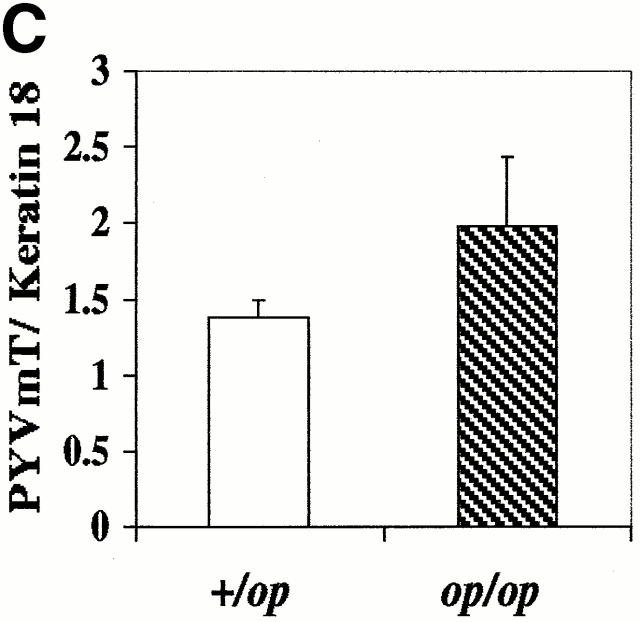
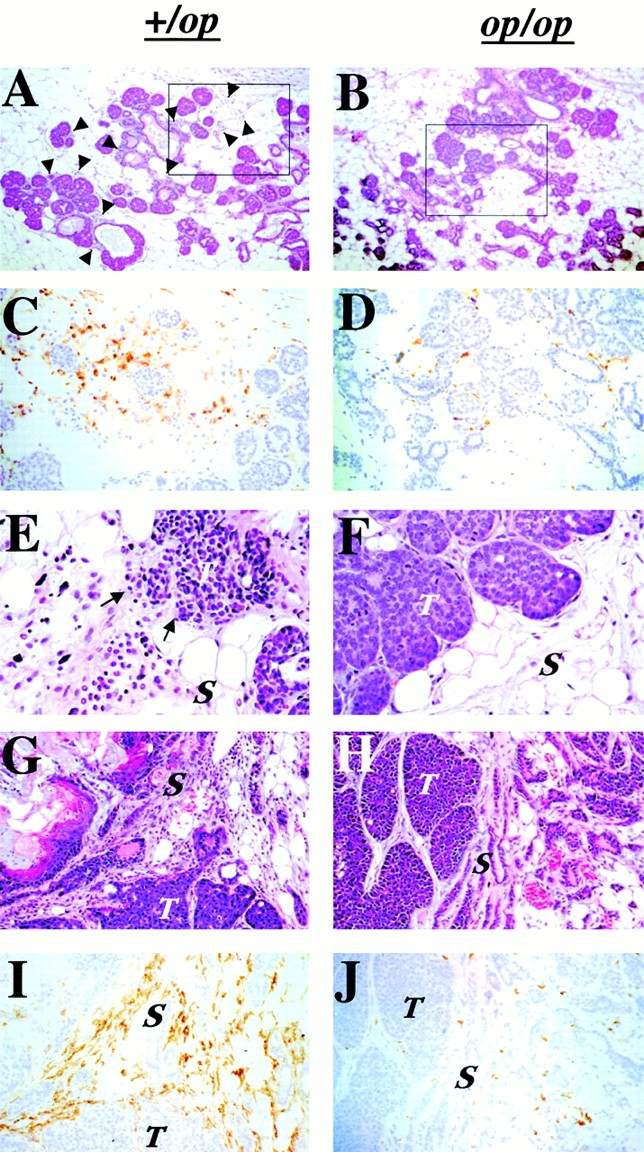
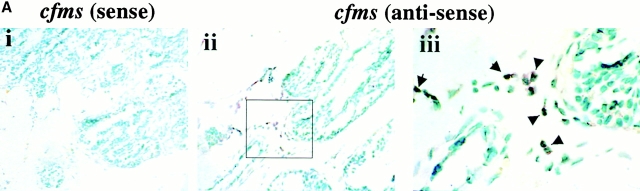
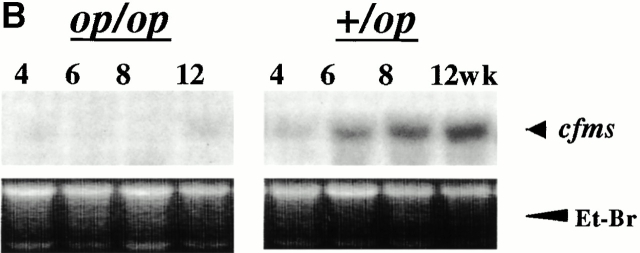
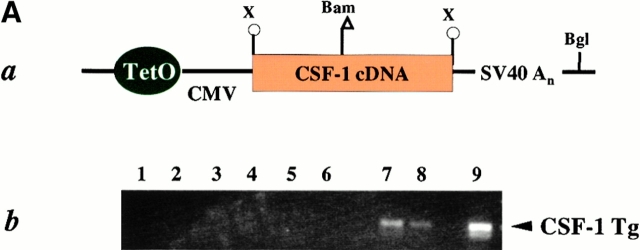
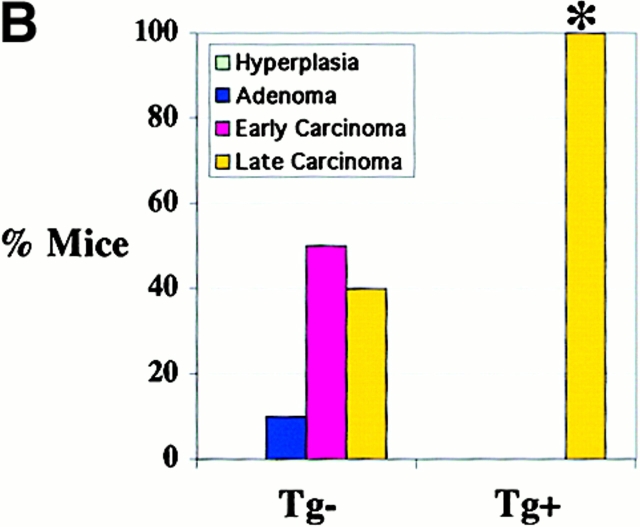
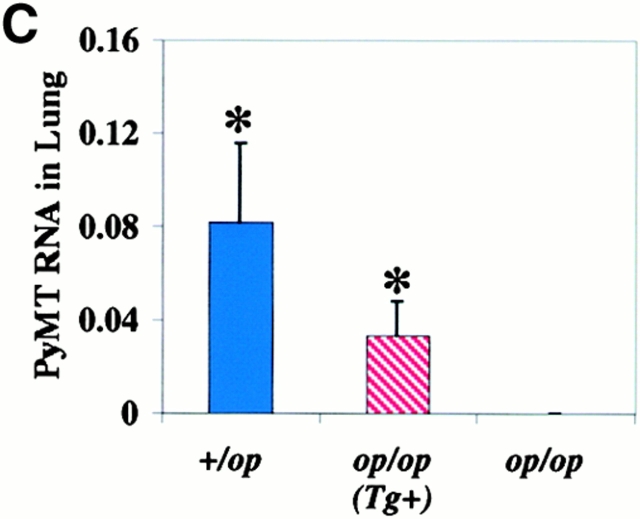
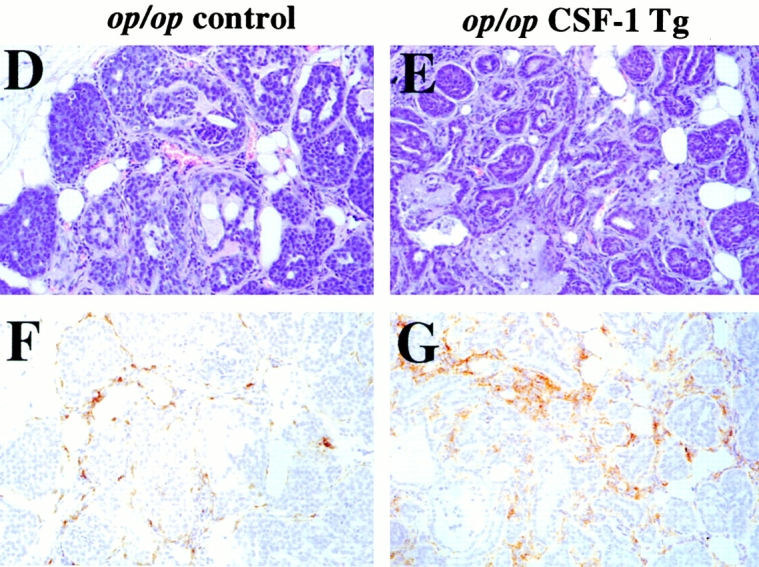
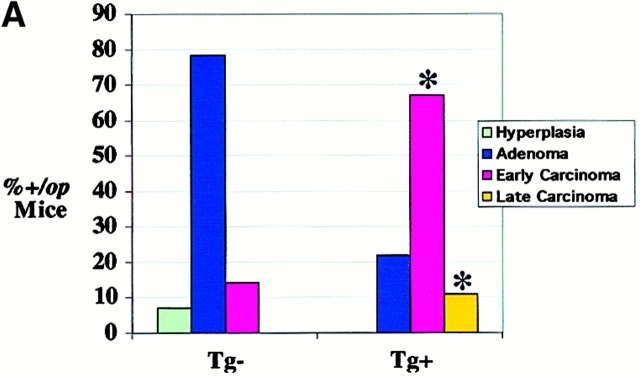
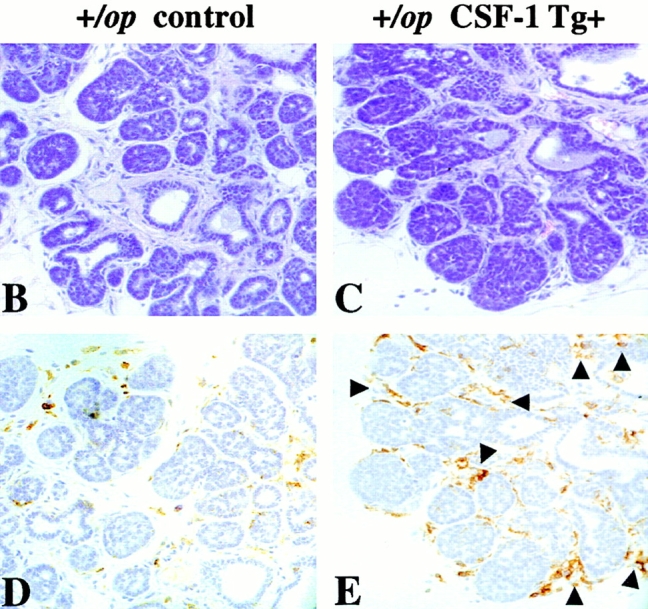
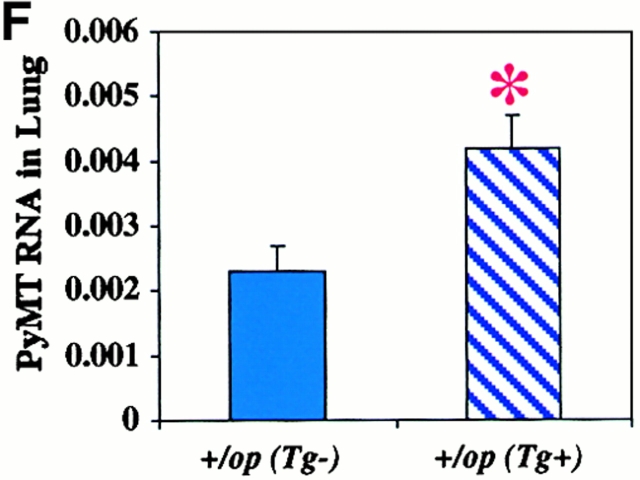
In human breast carcinomas, overexpression of the macrophage colony-stimulating factor (CSF-1) and its receptor (CSF-1R) correlates with poor prognosis. To establish if there is a causal relationship between CSF-1 and breast cancer progression, we crossed a transgenic mouse susceptible to mammary cancer with mice containing a recessive null mutation in the CSF-1 gene (Csf1(op)) and followed tumor progression in wild-type and null mutant mice. The absence of CSF-1 affects neither the incidence nor the growth of the primary tumors but delayed their development to invasive, metastatic carcinomas. Transgenic expression of CSF-1 in the mammary epithelium of both Csf1(op)/Csf1(op) and wild-type tumor-prone mice led to an acceleration to the late stages of carcinoma and to a significant increase in pulmonary metastasis. This was associated with an enhanced infiltration of macrophages into the primary tumor. These studies demonstrate that the growth of mammary tumors and the development to malignancy are separate processes and that CSF-1 selectively promotes the latter process. CSF-1 may promote metastatic potential by regulating the infiltration and function of tumor-associated macrophages as, at the tumor site, CSF-1R expression was restricted to macrophages. Our data suggest that agents directed at CSF-1/CSF-1R activity could have important therapeutic effects.


Figures

Figure 1
Figure 1
Growth of mammary tumors was not inhibited in Csf1op/Csf1op PyMT mice. (A–D) Representative mammary whole mounts of +/Csf1op(A and C) and Csf1op/Csf1op PyMT mice (B and D) at ages indicated (original magnification: ×2.5). PT, the primary tumor in the nipple area; LN, the subiliac lymph node. Black arrowheads point to terminal-end buds and open arrowheads point to the tumor foci on ducts distal to the nipple. (E) Growth of primary mammary tumors in +/Csf1op(▪; n = 30) and Csf1op/Csf1op (○; n = 53) PyMT mice was measured in mammary whole mounts at the age indicated. Data are presented as the mean ± SE of at least four mice per group. No significant difference was found between the two groups at 4, 6, 8, and 10 wk (unpaired Student's t test). (F) Cell proliferation in primary tumors was determined by BrdU incorporation. Typical distribution of BrdU-positive cells (brown spots) in mammary tumor of +/Csf1op (i) and Csf1op/Csf1op (ii) PyMT mice at 8 wk of age (original magnification: ×100); (iii) comparison of densities of BrdU positive cells in primary tumors of +/Csf1op and Csf1op/Csf1op PyMT mice at 8 wk of age. No significant difference was found (unpaired Student's t test, n = 8). In this and other figures, +/op and op/op indicate +/Csf1op and Csf1op/Csf1op, respectively.
Figure 1
Figure 1
Growth of mammary tumors was not inhibited in Csf1op/Csf1op PyMT mice. (A–D) Representative mammary whole mounts of +/Csf1op(A and C) and Csf1op/Csf1op PyMT mice (B and D) at ages indicated (original magnification: ×2.5). PT, the primary tumor in the nipple area; LN, the subiliac lymph node. Black arrowheads point to terminal-end buds and open arrowheads point to the tumor foci on ducts distal to the nipple. (E) Growth of primary mammary tumors in +/Csf1op(▪; n = 30) and Csf1op/Csf1op (○; n = 53) PyMT mice was measured in mammary whole mounts at the age indicated. Data are presented as the mean ± SE of at least four mice per group. No significant difference was found between the two groups at 4, 6, 8, and 10 wk (unpaired Student's t test). (F) Cell proliferation in primary tumors was determined by BrdU incorporation. Typical distribution of BrdU-positive cells (brown spots) in mammary tumor of +/Csf1op (i) and Csf1op/Csf1op (ii) PyMT mice at 8 wk of age (original magnification: ×100); (iii) comparison of densities of BrdU positive cells in primary tumors of +/Csf1op and Csf1op/Csf1op PyMT mice at 8 wk of age. No significant difference was found (unpaired Student's t test, n = 8). In this and other figures, +/op and op/op indicate +/Csf1op and Csf1op/Csf1op, respectively.
Figure 2
Figure 2
Histopathological progression and metastasis of mammary tumors in Csf1op/Csf1op PyMT mice was delayed. (A) Pulmonary metastasis of mammary tumors in +/Csf1op and Csf1op/Csf1op PyMT mice was compared by Northern analysis of PyMT mRNA expression in lungs. Data are presented as the mean ± SE of at least three mice for each time point. Asterisk indicate the significant difference of +/Csf1op PyMT mice between 10 to 14 and 18 to 22 wk of age (Mann-Whitney test, P = 0.0016, n = 21), and the significant difference between +/Csf1op and Csf1op/Csf1op PyMT mice from 18 to 22 wk of age (Mann-Whitney test, P < 0.0001, n = 28). (B) Hematoxylin and eosin–stained lung section from a +/Csf1op PyMT mouse at 18 wk of age (original magnification: ×100). (C) PyMT mRNA levels in mammary gland epithelium of +/Csf1op and Csf1op/Csf1op PyMT mice from 6 to 12 wk of age were compared using Northern analysis. Mean ± SE of eight mice/group. No significant difference was found between the two groups (unpaired Student's t test). (D) Histopathological progression of primary tumors to late carcinoma in Csf1op/Csf1op PyMT mice was delayed compared with +/Csf1op littermates. Data are presented as the percentile distribution of primary tumors of +/Csf1op (n = 68) and Csf1op/Csf1op PyMT mice (n = 70) in four histopathological stages at the ages indicated. Asterisks indicate a significant difference in the frequency of late carcinoma stage tumors in mice older than 8 wk of age compared with mice of the same genotype at 8 wk of age (Fisher's exact test, P = 0.0087, 0.0004, and 0.0006 for +/Csf1op and P = 0.42, 0.077, and 0.0006 for Csf1op/Csf1op PyMT mice at 10, 16, and 22 wk of age, respectively).
Figure 2
Figure 2
Histopathological progression and metastasis of mammary tumors in Csf1op/Csf1op PyMT mice was delayed. (A) Pulmonary metastasis of mammary tumors in +/Csf1op and Csf1op/Csf1op PyMT mice was compared by Northern analysis of PyMT mRNA expression in lungs. Data are presented as the mean ± SE of at least three mice for each time point. Asterisk indicate the significant difference of +/Csf1op PyMT mice between 10 to 14 and 18 to 22 wk of age (Mann-Whitney test, P = 0.0016, n = 21), and the significant difference between +/Csf1op and Csf1op/Csf1op PyMT mice from 18 to 22 wk of age (Mann-Whitney test, P < 0.0001, n = 28). (B) Hematoxylin and eosin–stained lung section from a +/Csf1op PyMT mouse at 18 wk of age (original magnification: ×100). (C) PyMT mRNA levels in mammary gland epithelium of +/Csf1op and Csf1op/Csf1op PyMT mice from 6 to 12 wk of age were compared using Northern analysis. Mean ± SE of eight mice/group. No significant difference was found between the two groups (unpaired Student's t test). (D) Histopathological progression of primary tumors to late carcinoma in Csf1op/Csf1op PyMT mice was delayed compared with +/Csf1op littermates. Data are presented as the percentile distribution of primary tumors of +/Csf1op (n = 68) and Csf1op/Csf1op PyMT mice (n = 70) in four histopathological stages at the ages indicated. Asterisks indicate a significant difference in the frequency of late carcinoma stage tumors in mice older than 8 wk of age compared with mice of the same genotype at 8 wk of age (Fisher's exact test, P = 0.0087, 0.0004, and 0.0006 for +/Csf1op and P = 0.42, 0.077, and 0.0006 for Csf1op/Csf1op PyMT mice at 10, 16, and 22 wk of age, respectively).
Figure 3
Figure 3
Infiltration of leukocytes and F4/80+ cells at the tumor site was reduced in Csf1op/Csf1op PyMT mice. (A–D) Primary tumors in PyMT mice at 7 wk of age. Hematoxylin and eosin–stained +/Csf1op (A) and Csf1op/Csf1op (B) tumors (original magnification: ×100). Arrowheads indicate infiltrated leukocytes. The insets in A and B are shown in C and D as adjacent sections immunostained with anti-F4/80 monoclonal antibody (original magnification: ×250). (E and F) Hematoxylin and eosin–stained primary tumors from +/Csf1op (E) and Csf1op/Csf1op (F) PyMT mice at 9 wk. Arrows indicate the site at which the tumor acini adjacent to zones of leukocyte infiltration display disrupted boundaries (original magnification: ×400). (G–J) Primary mammary tumors at late adenocarcinoma stage. (G and H) Hematoxylin and eosin–stained mammary primary tumors; (I and J) adjacent sections immunostained with anti-F4/80 monoclonal antibody from +/Csf1op and Csf1op/ Csf1op PyMT mice at 19 and 20 wk of age, respectively (original magnification: ×250). T, tumor; S, stroma.
Figure 4
Figure 4
Expression of CSF-1R was found in macrophage-like cells. (A) CSF-1R expressing cells at the tumor site were identified by in situ hybridization for cfms. Primary mammary tumor from a +/Csf1op PyMT mouse at 14 wk of age was hybridized with sense (i) and antisense (ii) cfms probes, respectively (original magnification: ×250). The inset in panel (ii) is shown in panel (iii; original magnification: ×1,000). Arrows indicate positively stained cells. (B) Northern analysis of cfms mRNA in mammary glands of +/Csf1op and Csf1op/Csf1op PyMT mice at the ages indicated. Et-Br, the same gel stained with ethidium bromide.
Figure 4
Figure 4
Expression of CSF-1R was found in macrophage-like cells. (A) CSF-1R expressing cells at the tumor site were identified by in situ hybridization for cfms. Primary mammary tumor from a +/Csf1op PyMT mouse at 14 wk of age was hybridized with sense (i) and antisense (ii) cfms probes, respectively (original magnification: ×250). The inset in panel (ii) is shown in panel (iii; original magnification: ×1,000). Arrows indicate positively stained cells. (B) Northern analysis of cfms mRNA in mammary glands of +/Csf1op and Csf1op/Csf1op PyMT mice at the ages indicated. Et-Br, the same gel stained with ethidium bromide.
Figure 5
Figure 5
Progression of mammary tumor to malignancy was accelerated in CSF-1–transgenic Csf1op/Csf1op PyMT mice. (A, a) Schematic diagram of CSF-1 transgenic construct. CSF-1 cDNA was ligated downstream of a CMV promoter controlled by tetracycline operators, TetO. SV40An, polyadenylation site from SV40 small t antigen; X, restriction site for XbaI, Bam, restriction site for BamHI; Bgl, restriction site for BglII. (A, b) RT-PCR analysis of transgenic CSF-1 expression in mammary glands. RNA samples were analyzed from four nontransgenic control (lanes 3–6), two CSF-1–transgenic (lanes 7 and 8), and the same CSF-1–transgenic PyMT mice without reverse transcriptase (lanes 1 and 2). Lane 9, genomic DNA from a CSF-1–transgenic mouse. CSF-1 Tg, positive 300-bp band. (B) Histopathological distribution of primary mammary tumors in CSF-1–transgenic and control Csf1op/Csf1opPyMT mice at 18 wk of age. Data are presented as the percentile distribution of four histopathological stages of primary mammary tumors in CSF-1–transgenic (Tg+, n = 6) and control (Tg−, n = 10) Csf1op/Csf1opPyMT mice. Asterisk indicates a significant difference in the frequency of late carcinoma stage tumors between CSF-1–transgenic and control Csf1op/Csf1opPyMT mice (Fisher's exact test, P = 0.039). (C) Pulmonary metastasis of mammary tumors in CSF-1–transgenic Csf1op/Csf1op and control PyMT mice at 18 wk of age were compared by Northern analysis of PyMT mRNA expression in lung. Data are presented as the mean ± SE of at least five mice/point. Asterisks indicate significant differences for both CSF-1–transgenic Csf1op/Csf1op(Tg+, n = 6) and control +/Csf1op PyMT mice (n = 5) when compared with control Csf1op/Csf1op PyMT mice (n = 6) (Mann-Whitney test, P = 0.03 and 0.008, respectively). No significant difference was found between CSF-1–transgenic Csf1op/Csf1opand control +/Csf1op PyMT mice at the same age (Mann-Whitney test, P = 0.33). (D–G) Histology of mammary tumors from CSF-1–transgenic (E and G) and control (D and F) Csf1op/Csf1op PyMT mice at 18 wk of age. Stained with hematoxylin and eosin (D and E) and with anti-F4/80 antibody (F and G; original magnification: ×250).
Figure 5
Figure 5
Progression of mammary tumor to malignancy was accelerated in CSF-1–transgenic Csf1op/Csf1op PyMT mice. (A, a) Schematic diagram of CSF-1 transgenic construct. CSF-1 cDNA was ligated downstream of a CMV promoter controlled by tetracycline operators, TetO. SV40An, polyadenylation site from SV40 small t antigen; X, restriction site for XbaI, Bam, restriction site for BamHI; Bgl, restriction site for BglII. (A, b) RT-PCR analysis of transgenic CSF-1 expression in mammary glands. RNA samples were analyzed from four nontransgenic control (lanes 3–6), two CSF-1–transgenic (lanes 7 and 8), and the same CSF-1–transgenic PyMT mice without reverse transcriptase (lanes 1 and 2). Lane 9, genomic DNA from a CSF-1–transgenic mouse. CSF-1 Tg, positive 300-bp band. (B) Histopathological distribution of primary mammary tumors in CSF-1–transgenic and control Csf1op/Csf1opPyMT mice at 18 wk of age. Data are presented as the percentile distribution of four histopathological stages of primary mammary tumors in CSF-1–transgenic (Tg+, n = 6) and control (Tg−, n = 10) Csf1op/Csf1opPyMT mice. Asterisk indicates a significant difference in the frequency of late carcinoma stage tumors between CSF-1–transgenic and control Csf1op/Csf1opPyMT mice (Fisher's exact test, P = 0.039). (C) Pulmonary metastasis of mammary tumors in CSF-1–transgenic Csf1op/Csf1op and control PyMT mice at 18 wk of age were compared by Northern analysis of PyMT mRNA expression in lung. Data are presented as the mean ± SE of at least five mice/point. Asterisks indicate significant differences for both CSF-1–transgenic Csf1op/Csf1op(Tg+, n = 6) and control +/Csf1op PyMT mice (n = 5) when compared with control Csf1op/Csf1op PyMT mice (n = 6) (Mann-Whitney test, P = 0.03 and 0.008, respectively). No significant difference was found between CSF-1–transgenic Csf1op/Csf1opand control +/Csf1op PyMT mice at the same age (Mann-Whitney test, P = 0.33). (D–G) Histology of mammary tumors from CSF-1–transgenic (E and G) and control (D and F) Csf1op/Csf1op PyMT mice at 18 wk of age. Stained with hematoxylin and eosin (D and E) and with anti-F4/80 antibody (F and G; original magnification: ×250).
Figure 6
Figure 6
Tumor progression was accelerated in CSF-1–transgenic +/Csf1op PyMT mice. (A) Histopathological distribution of primary mammary tumors in CSF-1–transgenic and control +/Csf1op PyMT mice at 8 wk of age. Data are presented as the percentile distribution of histopathological stages of primary mammary tumors in CSF-1–transgenic (Tg+, n = 9) and control +/Csf1op PyMT mice (Tg−, n = 14). Asterisks indicate a significant difference in the frequency of carcinoma stage tumor between CSF-1–transgenic and control +/Csf1op PyMT mice (Fisher's exact test, P = 0.007). (B–E) Tumor histology and the distribution of F4/80+ cells in tumors of control (B and D) and CSF-1–transgenic (C and E) +/Csf1op PyMT mice at 5 wk of age. (B and C) Hematoxylin and eosin staining; (D and E) the adjacent sections stained with anti-F4/80 monoclonal antibody. Arrows indicate areas with high density of F4/80 cells. (F) Pulmonary metastasis of mammary tumors in CSF-1–transgenic and control +/Csf1op PyMT mice at 13 and 14 wk of age were compared by Northern analysis of PyMT mRNA expression in lung. Data are presented as the mean ± SE of at least three mice/point. Asterisks indicate a significant difference between CSF-1–transgenic +/Csf1op PyMT mice at 13 wk (Tg+) and control +/Csf1op PyMT mice at 14 wk of age (Tg−) (Mann-Whitney test, P = 0.029).
Figure 6
Figure 6
Tumor progression was accelerated in CSF-1–transgenic +/Csf1op PyMT mice. (A) Histopathological distribution of primary mammary tumors in CSF-1–transgenic and control +/Csf1op PyMT mice at 8 wk of age. Data are presented as the percentile distribution of histopathological stages of primary mammary tumors in CSF-1–transgenic (Tg+, n = 9) and control +/Csf1op PyMT mice (Tg−, n = 14). Asterisks indicate a significant difference in the frequency of carcinoma stage tumor between CSF-1–transgenic and control +/Csf1op PyMT mice (Fisher's exact test, P = 0.007). (B–E) Tumor histology and the distribution of F4/80+ cells in tumors of control (B and D) and CSF-1–transgenic (C and E) +/Csf1op PyMT mice at 5 wk of age. (B and C) Hematoxylin and eosin staining; (D and E) the adjacent sections stained with anti-F4/80 monoclonal antibody. Arrows indicate areas with high density of F4/80 cells. (F) Pulmonary metastasis of mammary tumors in CSF-1–transgenic and control +/Csf1op PyMT mice at 13 and 14 wk of age were compared by Northern analysis of PyMT mRNA expression in lung. Data are presented as the mean ± SE of at least three mice/point. Asterisks indicate a significant difference between CSF-1–transgenic +/Csf1op PyMT mice at 13 wk (Tg+) and control +/Csf1op PyMT mice at 14 wk of age (Tg−) (Mann-Whitney test, P = 0.029).

Comment in

References

    1. Greenlee R.T., Murray T., Bolden S., Wingo P.A. Cancer statistics, 2000. CA Cancer J. Clin. 2000;50:7–33. - PubMed
    1. Xie B., Tsao S.W., Wong Y.C. Sex hormone-induced mammary carcinogenesis in female Noble ratsexpression of TGF-beta1 and its receptors, TGF-alpha, and EGF-R in mammary carcinogenesis. Breast Cancer Res. Treat. 1999;58:227–239. - PubMed
    1. Dickson C., Creer A., Fantl V. Mammary gland oncogenes as indicators of pathways important in mammary gland development. Oncogene. 2000;19:1097–1101. - PubMed
    1. Hovey R.C., Davey H.W., Mackenszie D.D.S., McFadden T.B. Ontogeny and epithelial-stromal interactions regulate IGF expression in the ovine mammary gland. Mol. Cell. Endocrinol. 1998;136:139–144. - PubMed
    1. Stanley E.R., Guilbert L.T., Tushinski R.J., Bartelmez S.H. CSF-1 A mononuclear phagocyte lineage-specific hemopoietic growth factor. J. Cell. Biochem. 1983;21:151–159. - PubMed

Publication types

Substances