. 2001 Apr;21(7):2269-80.
doi: 10.1128/MCB.21.7.2269-2280.2001.

Association of insulin receptor substrate 1 (IRS-1) y895 with Grb-2 mediates the insulin signaling involved in IRS-1-deficient brown adipocyte mitogenesis

Affiliations

Association of insulin receptor substrate 1 (IRS-1) y895 with Grb-2 mediates the insulin signaling involved in IRS-1-deficient brown adipocyte mitogenesis

A M Valverde et al. Mol Cell Biol. 2001 Apr.

Abstract

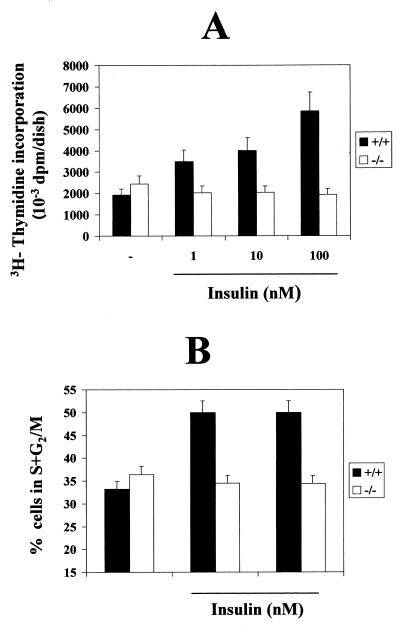
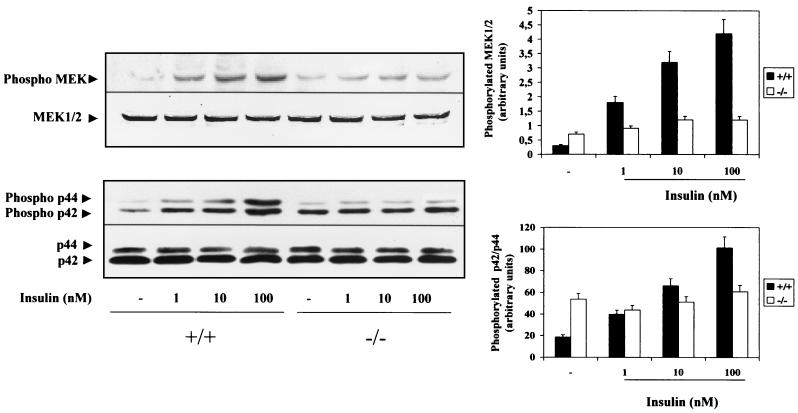
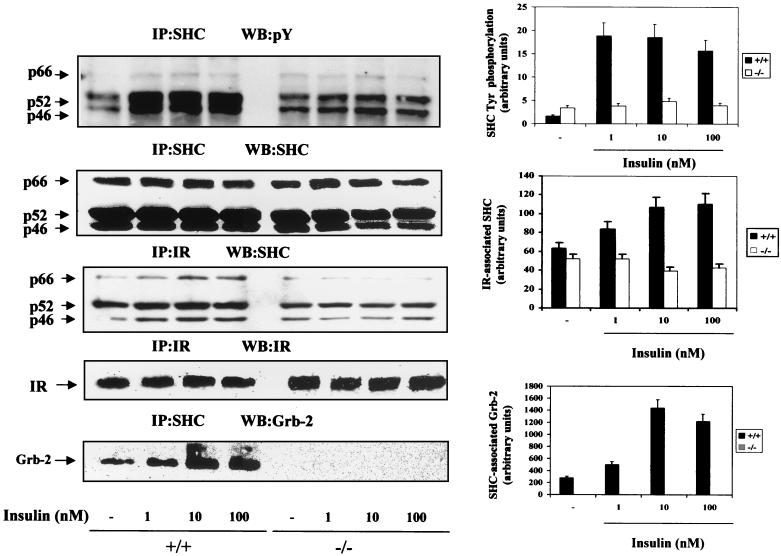
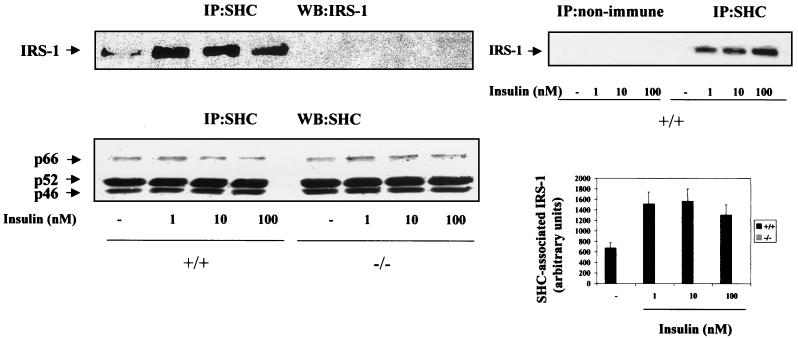
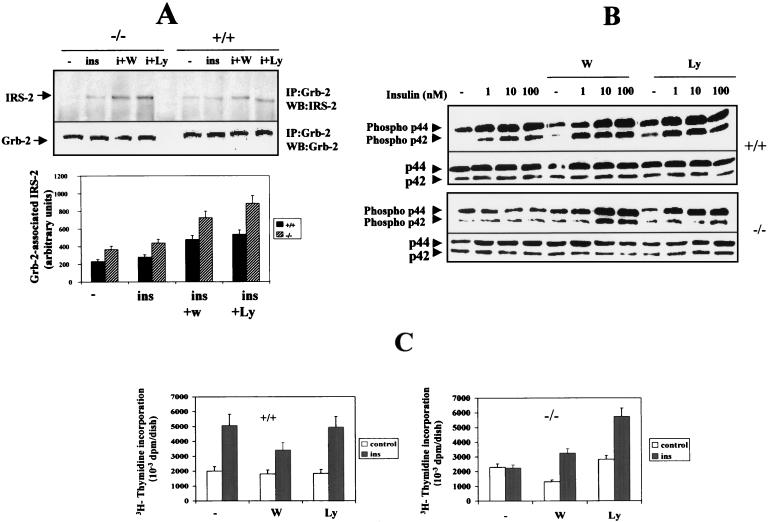
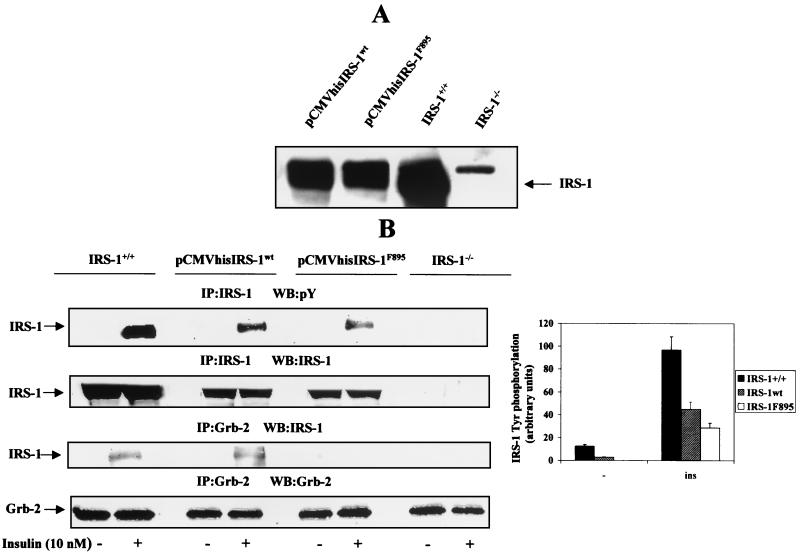
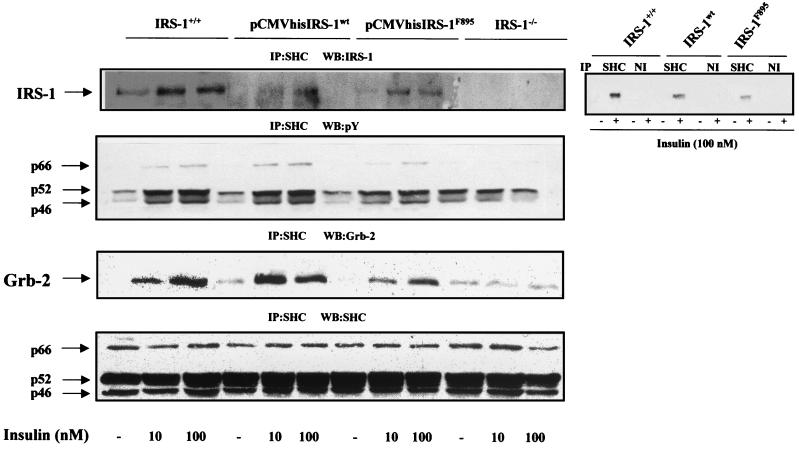
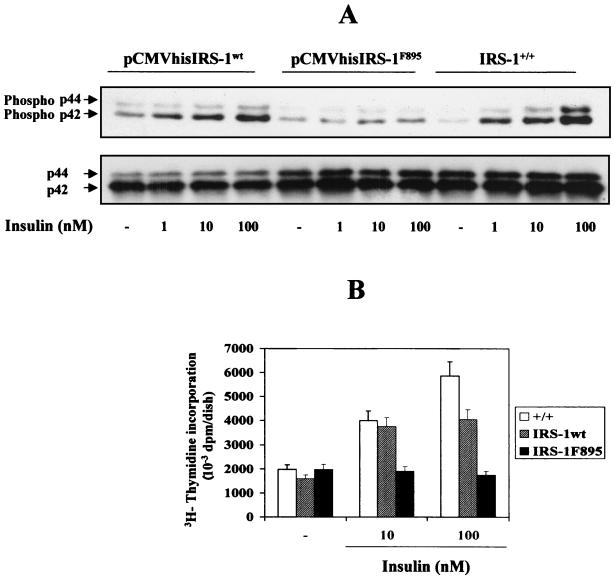
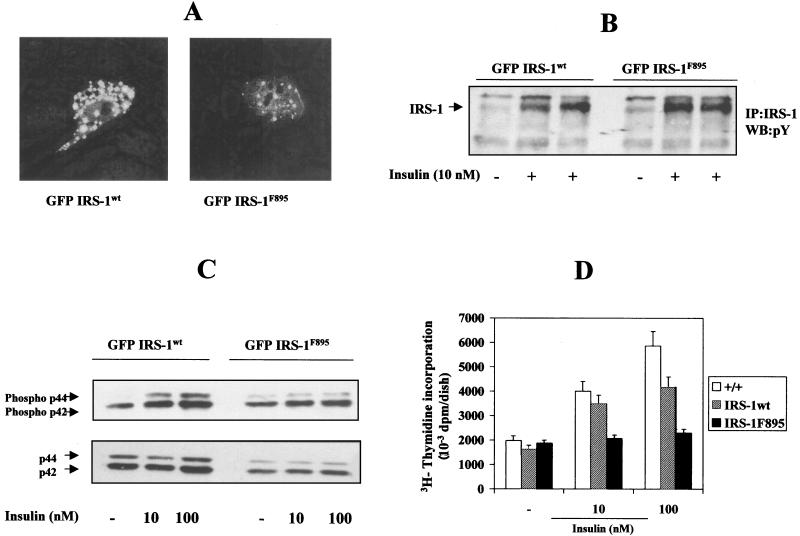
We have recently generated immortalized fetal brown adipocyte cell lines from insulin receptor substrate 1 (IRS-1) knockout mice and demonstrated an impairment in insulin-induced lipid synthesis as compared to wild-type cell lines. In this study, we investigated the consequences of IRS-1 deficiency on mitogenesis in response to insulin. The lack of IRS-1 resulted in the inability of insulin-stimulated IRS-1-deficient brown adipocytes to increase DNA synthesis and enter into S/G2/M phases of the cell cycle. These cells showed a severe impairment in activating mitogen-activated protein kinase kinase (MEK1/2) and p42-p44 mitogen-activated protein kinase (MAPK) upon insulin stimulation. IRS-1-deficient cells also lacked tyrosine phosphorylation of SHC and showed no SHC-Grb-2 association in response to insulin. The mitogenic response to insulin could be partially restored by enhancing IRS-2 tyrosine phosphorylation and its association with Grb-2 by inhibition of phosphatidylinositol 3-kinase activity through a feedback mechanism. Reconstitution of IRS-1-deficient brown adipocytes with wild-type IRS-1 restored insulin-induced IRS-1 and SHC tyrosine phosphorylation and IRS-1-Grb-2, IRS-1-SHC, and SHC-Grb-2 associations, leading to the activation of MAPK and enhancement of DNA synthesis. Reconstitution of IRS-1-deficient brown adipocytes with the IRS-1 mutant Tyr895Phe, which lacks IRS-1-Grb-2 binding, restored SHC-IRS-1 association and SHC-Grb-2 association. However, the lack of IRS-1-Grb-2 association impaired MAPK activation and DNA synthesis in insulin-stimulated mutant cells. These data provide strong evidence for an essential role of IRS-1 and its direct association with Grb-2 in the insulin signaling pathway leading to MAPK activation and mitogenesis in brown adipocytes.


Figures

FIG. 1
FIG. 1
Mitogenic response to insulin in wild-type and IRS-1-deficient brown adipocytes. (A) Three clones of wild-type (+/+) and IRS-1-deficient (−/−) immortalized brown adipocytes were cultured for 24 h in serum-free medium either in the absence or presence of insulin (1, 10, and 100 nM). DNA synthesis was determined by [3H]thymidine incorporation (0.2 μCi/ml) over the last 4 h of culture. After two washes with ice-cold PBS, cells were lysed and trichloroacetate-precipitable DNA was then counted for incorporated radioactivity. Results are expressed as disintegrations per minute (dpm) per dish and are means ± standard errors from six independent experiments, each one performed in triplicate. (B) Cells were cultured for 24 h either in the absence or presence of various doses of insulin as described for panel A. At the end of the culture time, the percentage of cells in S plus G2/M phases of the cell cycle was determined as described in Materials and Methods. Results are means ± standard errors from six independent experiments.
FIG. 2
FIG. 2
Insulin did not activate MAPK cascade in IRS-1-deficient brown adipocytes. Quiescent (20-h serum-starved) wild-type (+/+) and IRS-1-deficient (−/−) brown adipocytes were stimulated with insulin (1 to 100 nM) for 5 min. Control cells were cultured in the absence of the hormone. Cells were then lysed and equal amounts of protein (50 μg) were submitted to SDS-PAGE followed by Western blot analysis with the anti-phospho MEK1/2, anti-MEK1/2, anti-phospho MAPK, and anti-MAPK antibodies. The positions of phosphorylated MEK1/2 and p42-p44 MAPK are indicated by arrowheads. Results from a representative experiment are shown. The autoradiograms corresponding to five independent experiments, using two clones of each cell type, were quantitated by scanning densitometry. Results are expressed as arbitrary units of phosphorylated MEK1/2 and phosphorylated p42-p44 MAPK and are means ± standard errors.
FIG. 3
FIG. 3
Insulin effect on SHC tyrosine phosphorylation and its association with an insulin receptor and Grb-2 in wild-type and IRS-1-deficient brown adipocytes. Quiescent (20-h serum-starved) wild-type (+/+) and IRS-1-deficient (−/−) brown adipocytes were stimulated with insulin (1 to 100 nM) for 5 min. Control cells were cultured in the absence of the hormone. At the end of the culture time, cells were lysed and 600 μg of total protein was immunoprecipitated (IP) with anti-SHC or anti-insulin receptor (IR) antibodies. The resulting immune complexes were analyzed by Western blotting (WB) with anti-Tyr(P), anti-SHC, anti-IR, and anti-Grb-2 antibodies as indicated in each panel. The positions of p66, p52, and p46 SHC proteins and IR β-chain and Grb-2 are indicated by arrows. The results shown are representative of three experiments, which used two clones of each cell type. The corresponding autoradiograms were quantitated by scanning densitometry. Results are expressed as arbitrary units of SHC tyrosine phosphorylation, IR-associated SHC, or SHC-associated Grb-2 and are means ± standard errors.
FIG. 4
FIG. 4
IRS-1 coimmunoprecipitates with SHC in wild-type brown adipocytes. Quiescent (20-h serum-starved) wild-type (+/+) and IRS-1-deficient (−/−) brown adipocytes were stimulated with insulin (1 to 100 nM) for 5 min. Control cells were cultured in the absence of the hormone. At the end of the culture time, cells were lysed and 600 μg of total protein was immunoprecipitated (IP) with the anti-SHC monoclonal antibody. The resulting immune complexes were analyzed by Western blotting (WB) with polyclonal anti-IRS-1 and anti-SHC antibodies. The positions of IRS-1 and p66, p52, and p46 SHC proteins are indicated by arrowheads. The results shown are representative of three experiments, which used two different clones of IRS-1+/+ cells. The corresponding autoradiograms were quantitated by scanning densitometry. Results are expressed as arbitrary units of SHC-associated IRS-1 and are means ± standard errors (bottom right panel). As a nonimmune control, cell lysates from untreated and insulin-stimulated wild-type brown adipocytes were incubated with anti-SHC antibody or anti-mouse IgGs and were analyzed by Western blotting with the anti-IRS-1 antibody (upper right panel).
FIG. 5
FIG. 5
PI 3-kinase inhibitors increased insulin-induced Grb-2-associated IRS-2 and the mitogenic response in IRS-1-deficient brown adipocytes. (A) Quiescent IRS-1+/+ (+/+) and IRS-1−/− (−/−) brown adipocytes were pretreated for 45 min with either 40 nM wortmannin (W) or 5 μM LY294002 (Ly) and then stimulated with 10 nM insulin (ins; also designated i) for a further 5 min. Cells were lysed and immunoprecipitated (IP) with the anti-Grb-2 antibody and analyzed by Western blotting (WB) with anti-IRS-2 or anti-Grb-2 antibodies. Results from a representative experiment are shown. The autoradiograms corresponding to three independent experiments, which used two different clones of each cell type, were quantitated by scanning densitometry. Results are expressed as arbitrary units of Grb-2-associated IRS-2 and are means ± standard errors. (B) Cells were preincubated with 40 nM wortmannin (W) or 5 μM LY294002 (Ly) as described for panel A. Then cells were further stimulated for 5 min with various doses of insulin and were lysed. Equal amounts of protein (30 to 50 μg) were submitted to Western blot analysis with anti-phospho p42-p44 MAPK and anti-MAPK antibodies. Results from a representative experiment of three experiments are shown. (C) Quiescent wild-type and IRS-1−/− brown adipocytes were cultured for 24 h with 100 nM insulin in both the absence and presence of either 40 nM wortmannin or 5 μM LY294002. [3H]thymidine incorporation into acid-insoluble material was determined during the last 4 h of culture. Results are expressed as disintegrations per minute (dpm) per dish and are means ± standard errors from six independent experiments, which used three different clones of each cell type.
FIG. 6
FIG. 6
Reconstitution of IRS-1 expression in IRS-1-deficient brown adipocytes. (A) IRS-1-deficient brown adipocytes (clone 4) were cultured in the presence of 10% FCS until 60 to 70% confluence was reached. Then cells were transfected with pCMVhis IRS-1wt and pCMVhis IRS-1F895 cDNA constructs according to the calcium phosphate-mediated protocol. Twenty-four hours after transfection, histidinol (10 mM) was added to select stable transfectants. Several histidinol-resistant cell lines were obtained, and the expression of IRS-1wt and the mutant IRS-1F895 was assessed by Western blot analysis with anti-IRS-1 antibody. (B) Quiescent cells were stimulated with 10 nM insulin for 5 min, and total cell lysates were immunoprecipitated (IP) with anti-IRS-1 or anti-Grb-2 antibodies. The resulting immune complexes were analyzed by Western blotting (WB) with anti-Tyr(P), anti-IRS-1, and anti-Grb-2 antibodies as indicated for each panel. The positions of IRS-1 and Grb-2 are indicated. A representative experiment is shown. The autoradiograms corresponding to three independent experiments, which used two clones of reconstituted cells, were quantitated by scanning densitometry. Results are expressed as arbitrary units of tyrosine phosphorylated IRS-1 and are means ± standard errors.
FIG. 7
FIG. 7
Reconstitution of IRS-1wt or IRS-1F895 restored IRS-1–SHC coimmunoprecipitation and SHC signaling. Quiescent cells (IRS-1+/+, IRS-1−/−, and pCMVhis IRS-1wt and pCMVhis IRS-1F895 transfectants) were stimulated with insulin (10 to 100 nM) for 5 min. Control cells were cultured in the absence of hormone. Total cell lysates were immunoprecipitated (IP) with anti-SHC antibody and were subsequently analyzed by Western blotting with anti-IRS-1, anti-Tyr(P), anti-Grb-2, and anti-SHC antibodies as indicated on each panel. The results shown are representative of 4 to 5 experiments, which used two clones of reconstituted cells. As a nonimmune control, cell lysates from untreated and insulin (100 nM)-stimulated wild-type, pCMVhis IRS-1wt, and pCMVhis IRS-1F895 brown adipocytes were incubated with anti-SHC antibody or anti-mouse IgGs and analyzed by Western blotting with the anti-IRS-1 antibody (right panel).
FIG. 8
FIG. 8
Reconstitution of IRS-1wt, but not IRS-1F895, restores MAPK activation and mitogenesis in brown adipocytes. (A) Quiescent cells (IRS-1+/+ and pCMVhis IRS-1wt and pCMVhis IRS-1F895 stable transfectants) were stimulated with various doses of insulin for 5 min, and total protein was submitted to Western blot analysis with anti-phospho MAPK and anti-MAPK antibodies. Results from a representative experiment out of three, which used two clones of reconstituted cells, are shown. (B) Cells were cultured for 24 h in a serum-free medium either in the absence or presence of insulin (10 to 100 nM). DNA synthesis was determined by [3H]thymidine incorporation (0.2 μCi/ml) over the last 4 h of culture. Results are expressed as disintegrations per minute (dpm) per dish and are means ± standard errors from six independent experiments, each one performed in triplicate. +/+, IRS-1+/+.
FIG. 9
FIG. 9
Reconstitution of insulin-induced mitogenesis by transient transfection with GFP–IRS-1wt, but not with GFP–IRS-1F895, construct. (A) IRS-1-deficient brown adipocytes were transfected with the GFP–IRS-1wt and GFP–IRS-1F895 cDNA constructs as described in Materials and Methods. A representative image of fluorescent cells is shown. (B) Quiescent cells were stimulated with 10 nM insulin for 5 min, and total cell lysates were immunoprecipitated (IP) with anti-IRS-1 antibody. The resulting immune complexes were analyzed by Western blotting (WB) with the anti-Tyr(P) antibody. The position of IRS-1 is indicated. A representative experiment is shown. (C) Quiescent cells (IRS-1+/+ and pGFPIRS-1wt and pGFPIRS-1F895 transfectants) were stimulated with insulin (10 and 100 nM) for 5 min, and total cell lysates were submitted to Western blot analysis with the anti-phospho MAPK and anti-MAPK antibodies. A representative autoradiogram is shown. (D) Cells were cultured for 24 h in a serum-free medium either in the absence or presence of insulin (10 to 100 nM). DNA synthesis was determined by [3H]thymidine incorporation (0.2 μCi/ml) over the last 4 h of culture. After two washes with ice-cold PBS, cells were lysed and trichloroacetate-precipitable DNA was then counted for incorporated radioactivity. Results are expressed as disintegrations per minute (dpm) per dish and are means ± standard errors from six independent experiments, each one performed in triplicate. +/+, IRS-1+/+.

Similar articles

Cited by

References

    1. Araki E, Lipes M A, Patti M E, Brüning J C, Haag III B L, Johnson R S, Kahn C R. Alternative pathway of insulin signalling in mice made with targeted disruption of the IRS-1 gene. Nature. 1994;372:186–190. - PubMed
    1. Backer J M, Myers M G, Jr, Schoelson S E, Chin D J, Sun X J, Miralpeix M, Hu P, Margolis B, Skolnik E Y, Schlessinger J, White M F. The phosphatidylinositol 3-kinase is activated by association with IRS-1 during insulin stimulation. EMBO J. 1992;11:3469–3479. - PMC - PubMed
    1. Baserga R. Growth regulation of the PCNA gene. J Cell Sci. 1991;98:433–436. - PubMed
    1. Bradford M. A rapid and sensitive method for the quantitation of microgram quantities of protein utilizing the principle of protein-dye binding. Anal Biochem. 1976;72:248–254. - PubMed
    1. Brüning J C, Winnay J, Cheatham B, Kahn C R. Differential signaling by insulin receptor substrate 1 (IRS-1) and IRS-2 in IRS-1-deficient cells. Mol Cell Biol. 1997;17:1513–1521. - PMC - PubMed

Publication types