. 2001 Mar 27;98(7):4202-8.
doi: 10.1073/pnas.071054698. Epub 2001 Mar 20.

Role of the arginine-nitric oxide pathway in the regulation of vascular smooth muscle cell proliferation

Affiliations

Role of the arginine-nitric oxide pathway in the regulation of vascular smooth muscle cell proliferation

L J Ignarro et al. Proc Natl Acad Sci U S A. .

Abstract

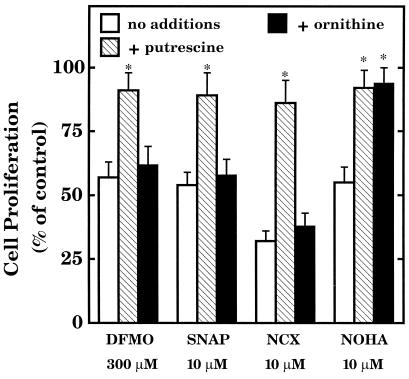
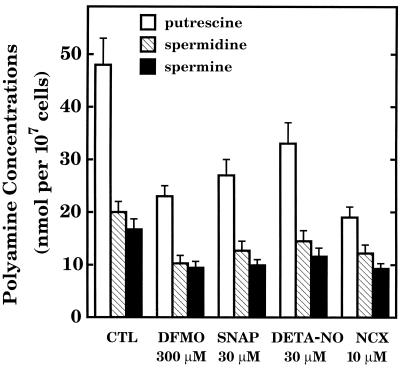
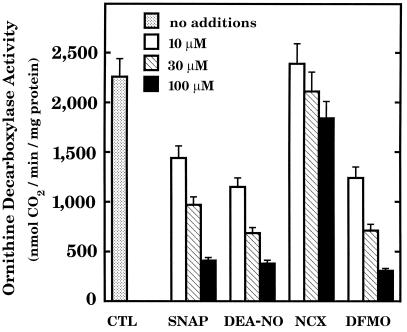
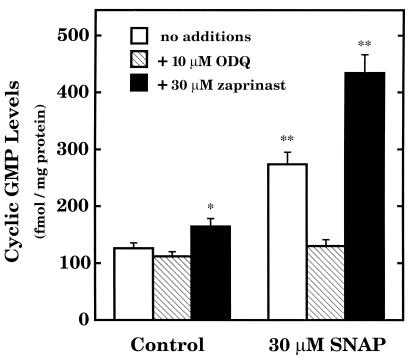
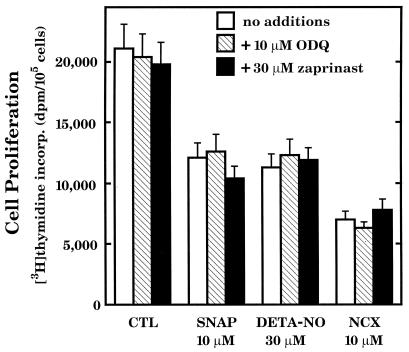
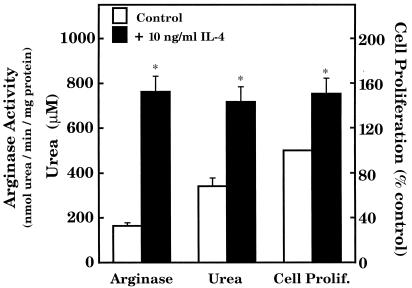
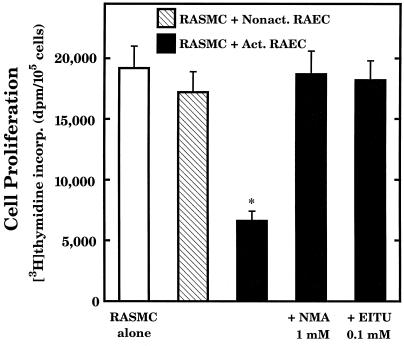
The objective of this study was to elucidate the mechanisms by which nitric oxide (NO) inhibits rat aortic smooth muscle cell (RASMC) proliferation. Two products of the arginine-NO pathway interfere with cell growth by distinct mechanisms. N(G)-hydroxyarginine and NO appear to interfere with cell proliferation by inhibiting arginase and ornithine decarboxylase (ODC), respectively. S-nitroso-N-acetylpenicillamine, (Z)-1-[N-(2-aminoethyl)-N-(2-aminoethyl)-amino]-diazen-1-ium-1,2-diolate, and a nitroaspirin derivative (NCX 4016), each of which is a NO donor agent, inhibited RASMC growth at concentrations of 1-3 microM by cGMP-independent mechanisms. The cytostatic action of the NO donor agents as well as alpha-difluoromethylornithine (DFMO), a known ODC inhibitor, was prevented by addition of putrescine but not ornithine. These observations suggested that NO, like DFMO, may directly inhibit ODC. Experiments with purified, recombinant mammalian ODC revealed that NO inhibits ODC possibly by S-nitrosylation of the active site cysteine in ODC. DFMO, as well as the NO donor agents, interfered with cellular polyamine (putrescine, spermidine, spermine) production. Conversely, increasing the expression and catalytic activity of arginase I in RASMC either by transfection of cells with the arginase I gene or by induction of arginase I mRNA with IL-4 resulted in increased urea and polyamine production as well as cell proliferation. Finally, coculture of rat aortic endothelial cells, which had been pretreated with lipopolysaccharide plus a cytokine mixture to induce NO synthase and promote NO production, caused NO-dependent inhibition of target RASMC proliferation. This study confirms the inhibitory role of the arginine-NO pathway in vascular smooth muscle proliferation and indicates that one mechanism of action of NO is cGMP-independent and attributed to its capacity to inhibit ODC.


Figures

Figure 1
Figure 1
Inhibition of RASMC proliferation by SNAP, DETA-NO, NCX 4016 (NCX), and DFMO. Cell proliferation was assessed by thymidine incorporation into DNA during the final 24 h of RASMC incubation, as described in the text. Test agents were added to cells at the time of thymidine addition. The concentrations of test agents were (from left to right for each test agent): SNAP, 1, 3, 10, and 30 μM; DETA-NO, 3, 10, 30, and 100 μM; NCX, 1, 3, 10, and 30 μM; DFMO, 100 μM, 300 μM, and 1 mM. Data were calculated as dpm per 105 cells per well and expressed as percentage of control (assigned 100%), where control represents cells grown in the absence of added test agents. Each of the points was significantly different (P < 0.05) from control (100%) except the value for 3 μM DETA-NO (P > 0.05). Data represent means ± SE of duplicate determinations from 3–4 separate experiments.
Figure 2
Figure 2
Influence of added putrescine or ornithine on the cytostatic actions of DFMO, SNAP, NCX 4016 (NCX), and NOHA in RASMC. Cell proliferation was assessed by thymidine incorporation into DNA during the final 24 h of RASMC incubation, as described in the text. Test agents were added to cells at the time of thymidine addition. Putrescine (100 μM) or ornithine (100 μM) was added to cells at the same time as the test agents. Data were calculated as dpm per 105 cells per well and expressed as percentage of control (assigned 100%), where control represents cells grown in the absence of added test agents. * signifies statistically significant difference (P < 0.05) from corresponding control (no additions). Data represent means ± SE of duplicate determinations from four separate experiments.
Figure 3
Figure 3
Inhibition of polyamine production in RASMC by DFMO, SNAP, DETA-NO, and NCX 4016 (NCX). Test agents were added to RASMC 24 h before determination of polyamine concentrations. Cells were washed, lysed, and extracted as described in the text. Concentrations of spermidine and spermine are expressed as nmol per 107 cells. Putrescine concentrations are actually 100-fold lower than indicated and, therefore, should be multiplied by 10−2 to obtain the true values. All values for polyamine concentrations in the presence of added test agents were significantly different (P < 0.05) from values for control (CTL). Data represent means ± SE of duplicate determinations from 4–5 separate experiments.
Figure 4
Figure 4
Inhibition of purified ODC by SNAP, DEA-NO, NCX 4016 (NCX) and DFMO. DTT was separated from the enzyme by gel filtration through a Sephadex G-25 column. ODC was preincubated with the test agents, as indicated, at 37°C for 15 min. Enzyme mixture was then added to assay buffer containing 0.4 mM ornithine (labeled with 0.1 μCi l-[1-14C]ornithine; 55 Ci/mmol) and 40 μM pyridoxal 5′-phosphate. ODC activity was measured after 30-min incubation at 37°C as described (6). All concentrations of SNAP, DEA-NO, and DFMO tested inhibited ODC significantly (P < 0.05). NCX was not active (P > 0.05). CTL, control. Data represent means ± SE of duplicate determinations from four separate experiments.
Figure 5
Figure 5
Stimulation of cGMP production in RASMC by SNAP. RASMC were grown to 80% confluence and used in experiments. Cells were pretreated with ODQ or zaprinast as indicated for 15 min. SNAP was added for 30 sec, after which time cell incubations were terminated by addition of 4 ml of ice-cold 65% ethanol. Cells were extracted with ethanol, and extracts then were assayed for cGMP as described in the text. * signifies that values were significantly different (P < 0.05) from control (no additions). ** signifies that values were significantly different (P < 0.05) from corresponding control values (absence of SNAP). Data represent means ± SE of triplicate determinations from three separate experiments.
Figure 6
Figure 6
Influence of added ODQ or zaprinast on the cytostatic actions of SNAP, DETA-NO, and NCX 4016 (NCX). Cell proliferation was assessed by thymidine incorporation into DNA during the final 24 h of RASMC incubation, as described in the text. Test agents were added to cells at the time of thymidine addition. ODQ (10 μM) or zaprinast (30 μM) was added to cells at the same time as the test agents. Data were calculated as dpm per 105 cells per well and expressed as such. Values for SNAP, DETA-NO, and NCX were not significantly different (P > 0.05) from corresponding values in the presence of either ODQ or zaprinast, but were significantly different (P < 0.05) from control (CTL) values. Values for ODQ or zaprinast alone were not significantly different (P > 0.05) from control values. Data represent means ± SE of duplicate determinations from four separate experiments.
Figure 7
Figure 7
Influence of IL-4 on arginase activity, urea production, and cell proliferation in RASMC. RASMC were plated at a density of 106 cells per 100-mm dish and grown to 80% confluence before the start of experiments. After 24-h incubation of RASMC with 10 ng/ml IL-4, the cells (≈5 × 10⁶) in each dish were ready for analysis. Some dishes were used for assessment of cell proliferation, whereas other dishes were used for determination of both urea and arginase activity. Cell proliferation was assessed by thymidine incorporation into DNA during the final 24 h of RASMC incubation, as described in the text. In separate dishes, cells were harvested and washed with ice-cold PBS, and the suspensions were centrifuged to sediment the cells. Sediments were lysed, and supernatants were assayed for arginase activity as described in the text. Cell culture media from the cells used for determination of arginase activity were collected for determination of urea levels, as described in the text. * signifies that values were significantly different (P < 0.05) from corresponding control values. Data represent means ± SE of duplicate determinations from 4–5 separate experiments.
Figure 8
Figure 8
Influence of arginase I transfection on arginase activity, urea production, and cell proliferation in RASMC. Transfection procedures are described in the text. RASMC were grown in 100-mm dishes and reached ≈5 × 10⁶ cells per dish just before analysis. Some dishes were used for assessment of cell proliferation, whereas other dishes were used for determination of both urea and arginase activity. Cell proliferation was assessed by thymidine incorporation into DNA during the final 24 h of RASMC incubation, as described in the text. In separate dishes, cells were harvested and washed with ice-cold PBS, and the suspensions were centrifuged to sediment the cells. Sediments were lysed and supernatants were assayed for arginase activity as described in the text. Cell culture media from the cells used for determination of arginase activity were collected for determination of urea levels, as described in the text. * signifies that values were significantly different (P < 0.05) from corresponding control values. Data represent means ± SE of duplicate determinations from 3–5 separate experiments.
Figure 9
Figure 9
Influence of NO-producing, activated RAEC on RASMC proliferation. Coculture, RAEC activation, and cell proliferation procedures are described in the text. As indicated, either 1 mM NG-methylarginine (NMA) or 0.1 mM S-ethylisothiourea (EITU) was added to cocultures at the start of coculture. After 24 h of coculture, 0.1 μCi of [methyl-3H]thymidine was added to each well and to each insert and incubated for another 24 h, after which time DNA synthesis in RASMC was assessed. * signifies that values were significantly different (P < 0.05) from values for RASMC alone. Data represent means ± SE of duplicate determinations from 3–4 separate experiments.

References

    1. Moncada S, Palmer R M J, Higgs E A. Pharmacol Rev. 1991;43:109–142. - PubMed
    1. Buga G M, Wei L H, Bauer P M, Fukuto J M, Ignarro L J. Am J Physiol. 1998;275:R1256–R1264. - PubMed
    1. Blachier F, Robert V, Selamnia M, Mayeur C, Duee P H. FEBS Lett. 1996;396:315–318. - PubMed
    1. Garg U C, Hassid A. Am J Physiol. 1989;257:F60–F66. - PubMed
    1. Garg U C, Hassid A. Biochem Biophys Res Commun. 1990;171:474–479. - PubMed

Publication types

MeSH terms