

The human macrophage cell line U937 as an in vitro model for selective evaluation of mycobacterial antigen-specific cytotoxic T-cell function
- PMID: 11260319
- PMCID: PMC1783164
- DOI: 10.1046/j.1365-2567.2001.01164.x
The human macrophage cell line U937 as an in vitro model for selective evaluation of mycobacterial antigen-specific cytotoxic T-cell function
Abstract
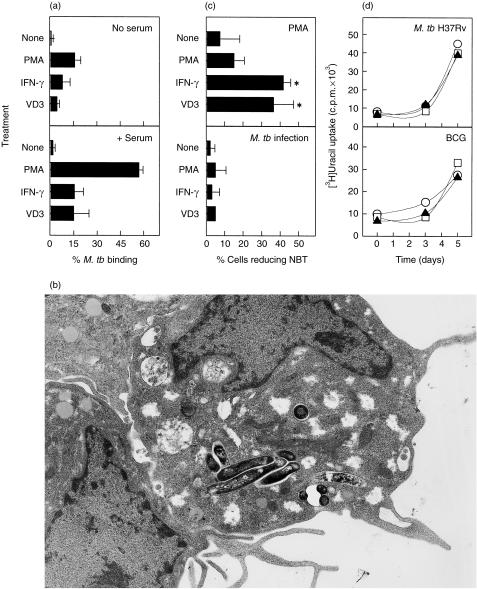
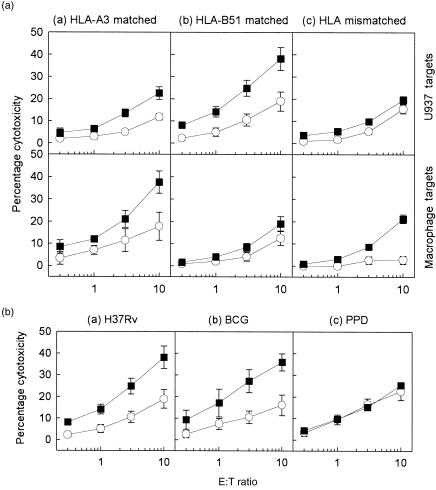
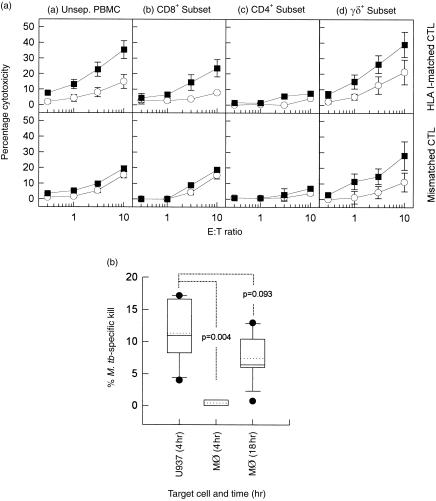
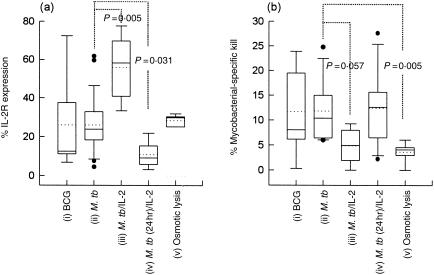
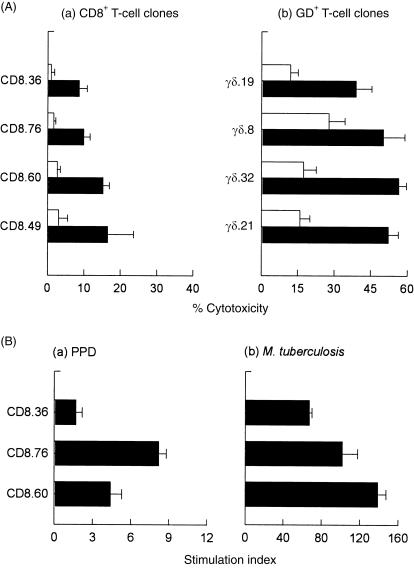
Despite strong evidence for CD8+ T-cell function in murine mycobacterial infections, their corresponding role in human tuberculosis has proven more difficult to demonstrate. We have evaluated the human macrophage (Mphi) cell line U937 as an in vitro model for human leucocyte antigen (HLA) class I-restricted presentation of mycobacterial antigens, as HLA class I is constitutively expressed at high levels by U937 cells in the absence of detectable HLA class II or CD1 molecules. U937 cells were evaluated for their ability to phagocytose Mycobacterium tuberculosis and for their ability to present mycobacterial antigens to human HLA class I-matched cytotoxic T lymphocytes (CTLs). Differentiated U937 cells were capable of efficient phagocytosis of M. tuberculosis but did not generate a subsequent respiratory burst response, and were permissive for intracellular growth of both bacillus Calmette-Guérin (BCG) and the virulent M. tuberculosis H37Rv strain. CTL activity was restricted to live mycobacterial organisms and was shown to be mediated by M. tuberculosis-specific, HLA class I-matched, purified CD8+ CTL lines and CD8+ T-cell clones. Furthermore, M. tuberculosis-infected U937 targets were more rapidly and strongly lysed by CD8+ CTLs than were infected autologous Mphi. Finally, M. tuberculosis-infected U937 cells simultaneously provided a sensitive indicator for detection of mycobacterial-specific, HLA-unrestricted gammadelta+ CTL activity.
Figures
Similar articles
-
Mycobacterium tuberculosis peptides presented by HLA-E molecules are targets for human CD8 T-cells with cytotoxic as well as regulatory activity.PLoS Pathog. 2010 Feb 26;6(2):e1000782. doi: 10.1371/journal.ppat.1000782. PLoS Pathog. 2010. PMID: 20195504 Free PMC article.
-
Mycobacterium tuberculosis-reactive CD8+ T lymphocytes: the relative contribution of classical versus nonclassical HLA restriction.J Immunol. 2000 Jul 15;165(2):925-30. doi: 10.4049/jimmunol.165.2.925. J Immunol. 2000. PMID: 10878367
-
Human CD8+ CTL specific for the mycobacterial major secreted antigen 85A.J Immunol. 2000 Dec 15;165(12):7088-95. doi: 10.4049/jimmunol.165.12.7088. J Immunol. 2000. PMID: 11120838
-
[CD1 pathway and NK T cell activation to glycolipid antigens from Mycobacterium tuberculosis].Gac Med Mex. 2005 Jan-Feb;141(1):35-41. Gac Med Mex. 2005. PMID: 15754749 Review. Spanish.
-
Cytotoxic T lymphocytes in resistance to tuberculosis.Adv Exp Med Biol. 1998;452:85-101. doi: 10.1007/978-1-4615-5355-7_11. Adv Exp Med Biol. 1998. PMID: 9889963 Review.
Cited by
-
In vitro toxicity assessment of bioavailable iron in coal varieties of Central India.PLoS One. 2024 Sep 19;19(9):e0309237. doi: 10.1371/journal.pone.0309237. eCollection 2024. PLoS One. 2024. PMID: 39298398 Free PMC article.
-
Investigating the Suitability of High Content Image Analysis as a Tool to Assess the Reversibility of Foamy Alveolar Macrophage Phenotypes In Vitro.Pharmaceutics. 2020 Mar 13;12(3):262. doi: 10.3390/pharmaceutics12030262. Pharmaceutics. 2020. PMID: 32183061 Free PMC article.
-
D-2-Hydroxyglutarate Is an Intercellular Mediator in IDH-Mutant Gliomas Inhibiting Complement and T Cells.Clin Cancer Res. 2018 Nov 1;24(21):5381-5391. doi: 10.1158/1078-0432.CCR-17-3855. Epub 2018 Jul 13. Clin Cancer Res. 2018. PMID: 30006485 Free PMC article.
-
Sorafenib and its derivative SC-49 sensitize hepatocellular carcinoma cells to CS-1008, a humanized anti-TNFRSF10B (DR5) antibody.Br J Pharmacol. 2013 Feb;168(3):658-72. doi: 10.1111/j.1476-5381.2012.02212.x. Br J Pharmacol. 2013. PMID: 22978563 Free PMC article.
-
Identifying putative Mycobacterium tuberculosis Rv2004c protein sequences that bind specifically to U937 macrophages and A549 epithelial cells.Protein Sci. 2005 Nov;14(11):2767-80. doi: 10.1110/ps.051592505. Epub 2005 Sep 30. Protein Sci. 2005. PMID: 16199660 Free PMC article.
References
-
- Kaleab B, Ottenoff T, Converse P, Halapi E, Tadesse G, Rottenberg M, Kiessling R. Mycobacterial-induced cytotoxic T lymphocyte as well as non-specific killer cells derived from healthy individuals and leprosy patients. Eur J Immunol. 1990;20:2651. - PubMed
-
- Lorgat F, Keraan MM, Lukey PT, Ress SR. Evidence for in vivo generation of cytotoxic T cells. PPD-stimulated lymphocytes from tuberculosis pleural effusions demonstrate enhanced cytotoxicity with accelerated kinetics of induction. Am Rev Respir Dis. 1992;145:418. - PubMed
-
- Barnes PF, Modlin RL, Ellner JJ. T cell responses and cytokines. In: Bloom BR, editor. Tuberculosis: Pathogenesis, Protection and Control. Washington: ASM Press; 1994. p. 417.
-
- De Libero G, Flesch I, Kaufmann SHE. Mycobacteria reactive Lyt2+ T cell lines. Eur J Immunol. 1988;18:59. - PubMed
-
- Serbina NV, Liu CC, Scanga CA, Flynn JL. CD8+ CTL from lungs of M. tuberculosis-infected mice express perforin in vivo and lyse infected macrophages. J Immunol. 2000;165:353. - PubMed
Publication types
MeSH terms
Substances
LinkOut - more resources
Full Text Sources
Medical
Research Materials
