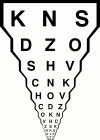
The development of a "reduced logMAR" visual acuity chart for use in routine clinical practice
- PMID: 11264133
- PMCID: PMC1723918
- DOI: 10.1136/bjo.85.4.432
The development of a "reduced logMAR" visual acuity chart for use in routine clinical practice
Abstract
Background/aims: The advantages of logMAR acuity data over the Snellen fraction are well known, and yet existing logMAR charts have not been adopted into routine ophthalmic clinical use. As this may be due in part to the time required for a logMAR measurement, this study was performed to determine whether an abbreviated logMAR chart design could combine the advantages of existing charts with a clinically acceptable measurement time.
Methods: The test-retest variability, agreement (with the gold standard), and time taken for "single letter" (interpolated) acuity measurements taken using three prototype "reduced logMAR" (RLM) charts and the Snellen chart were compared with those of the ETDRS chart which acted as the gold standard. The Snellen chart was also scored with the more familiar "line assignment" method. The subjects undergoing these measurements were drawn from a typical clinical outpatient population exhibiting a range of acuities.
Results: The RLM A prototype chart achieved a test-retest variability of +/-0.24 logMAR compared with +/-0.18 for the ETDRS chart. Test-retest variability for the Snellen chart was +/-0.24 logMAR using clinically prohibitive "single letter" scoring increasing to +/-0.33 with the more usual "line assignment" method. All charts produced acuity data which agreed well with those of the ETDRS chart. "Single letter" acuity measurements using the prototype RLM charts were completed in approximately half the time of those taken using the ETDRS and Snellen charts. The duration of a Snellen "line assignment" measurement was not evaluated.
Conclusion: The RLM A chart offers an acceptable level of test-retest variability when compared with the gold standard ETDRS chart, while reducing the measurement time by half. Also, by allowing a faster, less variable acuity measurement than the Snellen chart, the RLM A chart can bring the benefits of logMAR acuity to routine clinical practice.
Figures
References
Publication types
MeSH terms
LinkOut - more resources
Full Text Sources
Research Materials


