. 2001 Apr;132(7):1396-410.
doi: 10.1038/sj.bjp.0703922.

Xenopus tropicalis oocytes as an advantageous model system for the study of intracellular Ca(2+) signalling

Affiliations

Xenopus tropicalis oocytes as an advantageous model system for the study of intracellular Ca(2+) signalling

J S Marchant et al. Br J Pharmacol. 2001 Apr.

Abstract

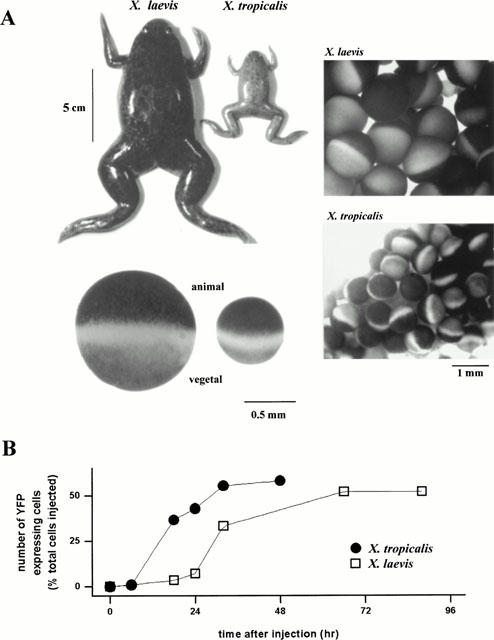
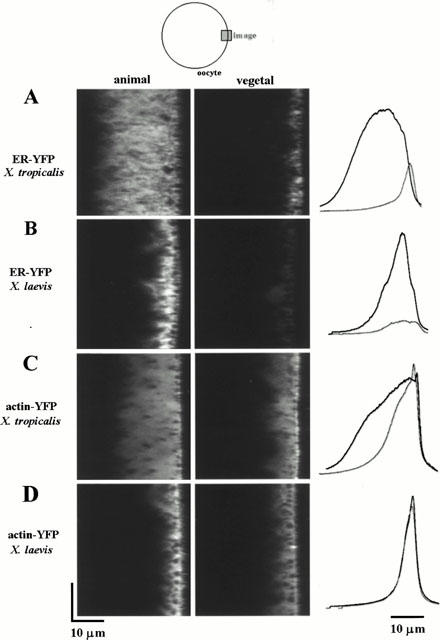
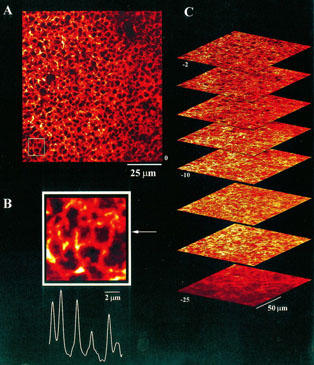
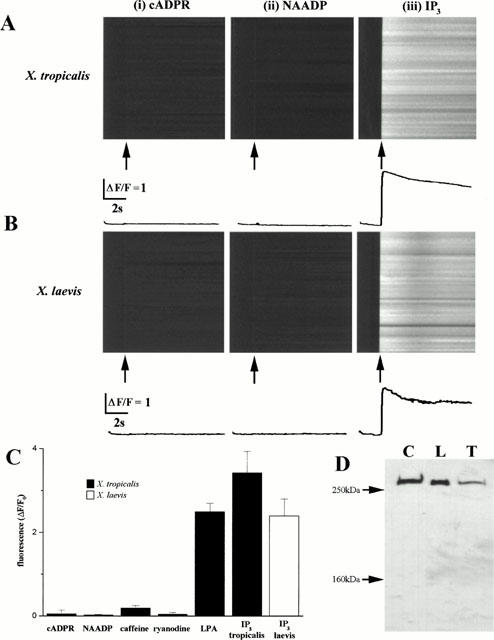
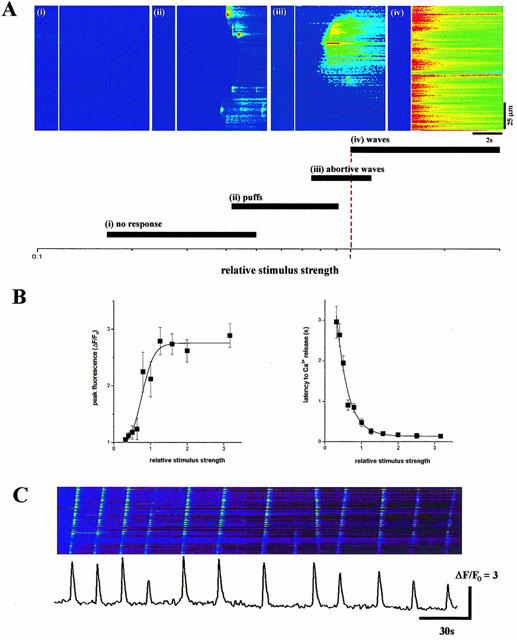
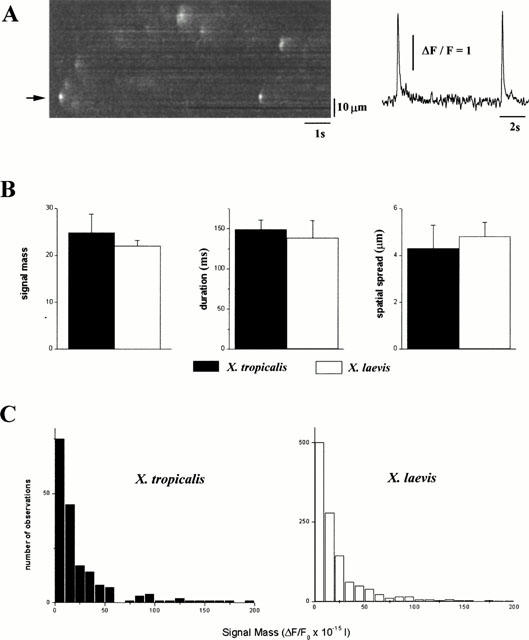
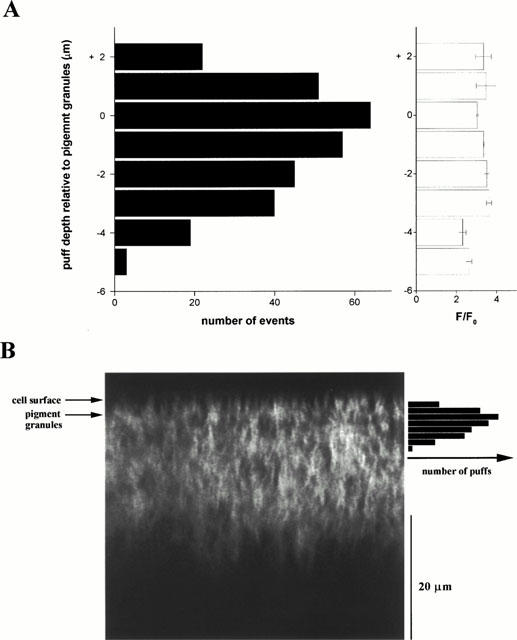
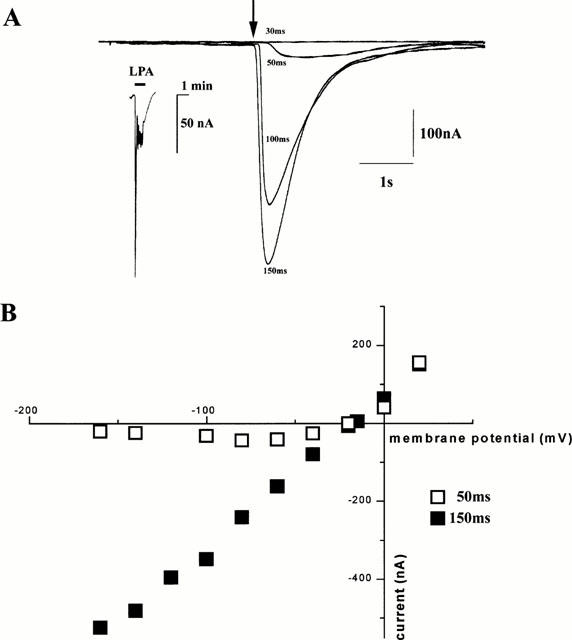
1. The purpose of this study was to compare oocytes from the pipid frogs Xenopus tropicalis and Xenopus laevis, with respect to their utility for studying Ca(2+) signalling mechanisms and for expression of heterologous proteins. 2. We show that X. tropicalis oocytes possess an intracellular Ca(2+) store that is mobilized by inositol (1,4,5) trisphosphate (IP(3)). Ca(2+) signalling is activated by endogenous lysophosphatidic acid receptors and cytosolic Ca(2+) activates a plasma membrane chloride conductance. The spatiotemporal organization of cytosolic Ca(2+) signals, from the microscopic architecture of elementary Ca(2+) 'puffs' to the macroscopic patterns of Ca(2+) spiking are closely similar to the local and global patterns of Ca(2+) release previously characterized in oocytes from X. laevis. 3. By injecting X. tropicalis oocytes with cDNA encoding an ER-targeted fluorescent protein construct, we demonstrate the capacity of the X. tropicalis oocyte to readily express heterologous proteins. The organization of ER is polarized across the oocyte, with the IP(3)-releaseable store targeted within an approximately 8 microm wide band that circumscribes the cell. 4. We conclude that the X. tropicalis oocyte shares many of the characteristics that have made oocytes of X. laevis a favoured system for studying Ca(2+) signalling mechanisms. Moreover, X. tropicalis oocytes display further practical advantages in terms of imaging depth, Ca(2+) signal magnitude and electrical properties. These further enhance the appeal of X. tropicalis as an experimental system, in addition to its greater amenability to transgenic approaches.


Figures

Figure 1
Figure 1
Morphological comparison between Xenopus laevis and Xenopus tropicalis and expression timecourse of an endoplasmic reticulum-targeted plasmid. (A) Photographic comparison of the sizes of adult X. tropicalis and X. laevis female frogs (top), a section from their ovarian lobes (right), and the appearance of their pigmented oocytes after defolliculation (bottom). (B) Timecourse of EYFP-ER expression after parallel nuclear injections of ∼5 nl of plasmid (200 μg ml−1) into oocytes from X. laevis and X. tropicalis. Batches of 50 oocytes from both donor frogs were injected in succession and individual oocytes screened at subsequent timepoints for EYFP fluorescence, together with a control batch of oocytes from each donor injected with intracellular solution alone. EYFP was visualized using the 488 nm line of an argon ion laser, with emitted fluorescence long pass filtered at λ>530 nm.
Figure 2
Figure 2
Asymmetric distribution of ER in the Xenopus tropicalis oocyte. (A) Radial (x – z) images of fluorescence intensity with depth (40 μm) in the animal and vegetal hemispheres of the same X. tropicalis oocyte taken 48 h after nuclear injection. The oocyte surface is near the right of each image frame, and the interior of the oocyte is to the left as shown in the schematic. Line profiles (traces at right) represent the fluorescence intensity averaged across the entire 50 μm laser scan line in the animal (black line) and in the vegetal hemisphere (gray line) relative to the depth of the most superficial fluorescence, averaged between >10 oocytes scored positive for EYFP fluorescence. The cross-sectional area of the fluorescent signal (area under the curve) was estimated by integration. In control oocytes, injected with intracellular solution alone, auto-fluorescence signals were less than 2% of the peak fluorescence signal in EYFP-expressing cells. (B) Analogous x – z scans in the animal and vegetal hemispheres of a X. laevis oocyte. (C) Images (x – z) from a X. tropicalis oocyte, 48 hrs after nuclear injection of a plasmid encoding an EYFP-tagged human cytoplasmic β-actin construct. (D) Analogous x – z scans in the animal and vegetal hemispheres of a X. laevis oocyte expressing the EYFP-tagged human cytoplasmic β-actin construct.
Figure 3
Figure 3
Expression of EYFP-ER in Xenopus tropicalis oocytes. Confocal (x – y) images collected at various focal depths into the animal hemisphere of a X. tropicalis oocyte 48 h after nuclear injection of a plasmid encoding a EYFP-ER construct. (A) Image collected with the microscope focused at the level of the cortical granules approximately 5 μm from the plasma membrane. (B) Enlargement of the indicated section from ‘A' together with a fluorescence intensity profile as measured as indicated by the arrow along a 3-pixel wide line. (C) An image stack of eight (x – y) images collected at increasing focal depths into the animal hemisphere, at 2 μm then 5 μm increments further into the cell, numbered relative to the level of the pigment granules (‘0'). Sequence starts 2 μm inward from the pigment granules.
Figure 4
Figure 4
Xenopus tropicalis oocytes contain solely an IP3-sensitive Ca2+ store. (A) Confocal linescan images showing the fluorescence change along a 100 μm scan line imaged using the low affinity Ca2+ indicator Oregon-green 5N after photoreleasing (i) cADPR, (ii) NAADP or (iii) IP3. The photolysis flash was delivered when indicated by the arrow, and was of the same intensity and duration. Images are representative of results from >10 X. tropicalis oocytes from at least three different donors, all microinjected with the same concentration of caged compound. Oocytes that were not responsive to cADPR and NAADP were shown to be viable, because photolysis flashes evoked Ca2+ release after the cells were subsequently injected with caged IP3 (data not shown). Accompanying traces represent the fluorescence profile, averaged across the entire 100 μm scan line during the period of photorelease. (B) Comparable experiments, performed using X. laevis oocytes. (C) Measurements of average peak fluorescence change from experiments such as those in (A) and (B), evoked by photorelease of saturating concentrations of caged IP3 (final intracellular concentration ∼5 μM), caged cyclic ADP ribose (∼5 μM), and caged NAADP (∼5 μM), and by bath application of LPA (1 μM), caffeine (10 mM) and ryanodine (5 μM). Filled bars show measurements in X. tropicalis oocytes. The open bar shows, for comparison, responses evoked by photoreleased IP3 in X. laevis oocytes. (D) Immunological identification of IP3 receptors in X. tropicalis oocytes. Lanes were loaded with 30 μg total protein from crude membrane preparations of rat cerebellum (‘C'), 50 oocytes of X. laevis (‘L') and 50 oocytes from X. tropicalis (‘T'). Blots were probed with an antibody raised against the C terminus of the rat cerebellar type-1 IP3 receptor (Cardy et al., 1997), and data are representative of three blots under identical conditions. The positions of molecular-mass markers (250 kDa, 160 kDa) are indicated by arrows.
Figure 5
Figure 5
IP3 evoked Ca2+ signals in Xenopus tropicalis oocytes. (A) Photorelease of increasing concentrations of IP3 cause a variety of spatiotemporal patterns of Ca2+ release from intracellular Ca2+ stores. Left, confocal linescan images (i, ii, iii, iv) depict increasing fluorescence ratios of Oregon-green-1 (increasing free [Ca2+]) on a linear pseudocolour scale after delivery of photolysis flashes of increasing intensity (80, 120, 160 and 200 ms, respectively) when indicated by the white line. Each image is representative of each of the indicated categories of Ca2+ liberation (shown below) from local to global signals that are progressively coordinated by increasing levels of IP3. Data are expressed in terms of the ‘relative stimulus strength', defined as the minimal photolytic duration that consistently evoked a Ca2+ wave that propagated across the entire 100 μm laser scan line (dashed red line). (B) Photorelease of increasing concentrations of IP3 cause a dose-dependent release of Ca2+ from IP3 sensitive Ca2+ stores after a variable latency. Left, measurements of peak fluorescence intensity averaged along a 100 μm laser scan line were made from images such as shown in (A), within the animal hemisphere of oocytes previously microinjected with the fluorescent Ca2+ indicator Oregon-green-1 (40 μM, final concentration) and caged IP3 (final concentration 5 μM). Similar results were obtained in the vegetal hemisphere of X. tropicalis oocytes, albeit over an intensity range lower than the animal hemisphere because of attenuation of u.v.-light by the pigment granules in the animal pole. Data represent the average from 12 oocytes from four donor frogs. Right, measurements of the latency to the first detectable release of Ca2+ across the entire 100 μm laser scan line obtained from the same experiment. (C) Linescan image of fluorescence along a 100 μm laser line during sustained photorelease of IP3 in the animal hemisphere of a X. tropicalis oocyte showing the occurrence of repetitive Ca2+ oscillations. Profile represents the fluorescence intensity across a 31 pixel (∼4 μm region) throughout this 4 min period.
Figure 6
Figure 6
Microscopic properties of elementary Ca2+ release events in Xenopus tropicalis oocytes. (A) Representative linescan image showing Ca2+ puffs evoked in the animal hemisphere of X. tropicalis oocytes by a photolysis flash of a strength ∼50% of that which triggered a propagating Ca2+ wave. Traces show fluorescence ratios measured from a 3 pixel (∼0.5 μm region) centered on the puff site indicated by the arrow. (B) Histograms comparing the average ‘signal mass' (Sun et al., 1998), half-duration and spatial spread (full width at half maximum amplitude) associated with Ca2+ puffs in X. tropicalis (filled bars) and X. laevis (open bars) oocytes. (C) Distributions of ‘signal mass' associated with Ca2+ puffs in X. tropicalis (n=182 events, filled bars) and X. laevis oocytes (n=1161 events, open bars). Events were recorded in the animal hemisphere of the oocytes using Oregon green 488 BAPTA-1. Note, 1 signal mass unit corresponds to a doubling of fluorescence throughout a volume of 1 fl, corresponding to approximately 2×10⁻²⁰ moles of calcium (Sun et al., 1998).
Figure 7
Figure 7
Axial distribution of Ca2+ puff sites in the X. tropicalis oocyte. (A) Radial distribution of Ca2+ puff sites plotted relative to the position of the pigment granules in each scan. Black bars show number of puffs (from a total of 301 events) observed at different radial depths in the animal hemisphere of X. tropicalis oocytes. Open bars depict measurements of the peak amplitude of the fluorescence change from the same events grouped by axial position. (B) Confocal z-scan image in a X. tropicalis oocyte expressing an ER-targeted EYFP construct, displayed in relation to the observed axial distribution of puff sites replotted from (A).
Figure 8
Figure 8
Ca2+ release from IP3 sensitive Ca2+ stores activates a Cl membrane conductance in Xenopus tropicalis oocytes. (A) Superimposed traces of whole cell membrane current showing increasing responses to progressively longer photolysis flashes (30, 50, 100 and 150 ms duration), delivered when indicated by the arrow with the oocyte clamped at −100 mV. Inset, membrane current evoked by superfusion of LPA (1 μM, black bar) in a X. tropicalis oocyte clamped at −60 mV. (B) Peak amplitude of membrane currents evoked by photorelease of caged IP3 in a X. tropicalis oocyte, with just suprathreshold (open squares, ∼50 ms duration) and strong (filled squares, ∼150 ms) photolysis flashes. The flash duration of 50 ms was slightly above the threshold (∼40 ms) to evoke a membrane current. Data are representative of responses obtained from a total of five oocytes from three different donor animals. Recordings were made at room temperature, with oocytes bathed in Ringer's solution.

Similar articles

Cited by

References

    1. AARHUS R., GEE K., LEE H.C. Caged cyclic ADP-ribose. J. Biol. Chem. 1995;270:7745–7749. - PubMed
    1. AMAYA E., OFFIELD M.F., GRAINGER R.M. Frog genetics: Xenopus tropicalis jumps into the future. Trends Genet. 1998;14:253–255. - PubMed
    1. BEREITER-HAHN J., VÖTH M. Dynamics of mitochondria in living cells: shape changes, dislocations, fusion, and fission of mitochondria. Microscopy Res. Technique. 1994;27:198. - PubMed
    1. BERRIDGE M.J. Elementary and global aspects of calcium signalling. J. Physiol. 1997;499:291–306. - PMC - PubMed
    1. BEZPROZVANNY I., EHRLICH B.E. Inositol (1,4,5)-trisphosphate (InsP3)-gated Ca channels from cerebellum: conduction properties for divalent cations and regulation by intraluminal calcium. J. Gen. Physiol. 1994;104:821–856. - PMC - PubMed

Publication types

MeSH terms

LinkOut - more resources